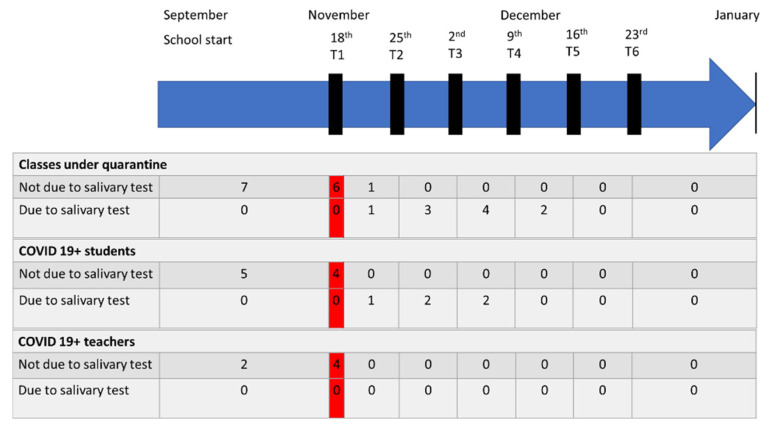
Figure 2.
Overview of the COVID-19-related quarantine trend during the first school term. The graphic shows the number of classes, students and teachers starting and ending the 14 days quarantine. In the red boxes, a photo of the situation at the beginning of the surveillance. At the left of the red boxes the quarantine and transmission status before the start of the surveillance, and at the right the status after.

