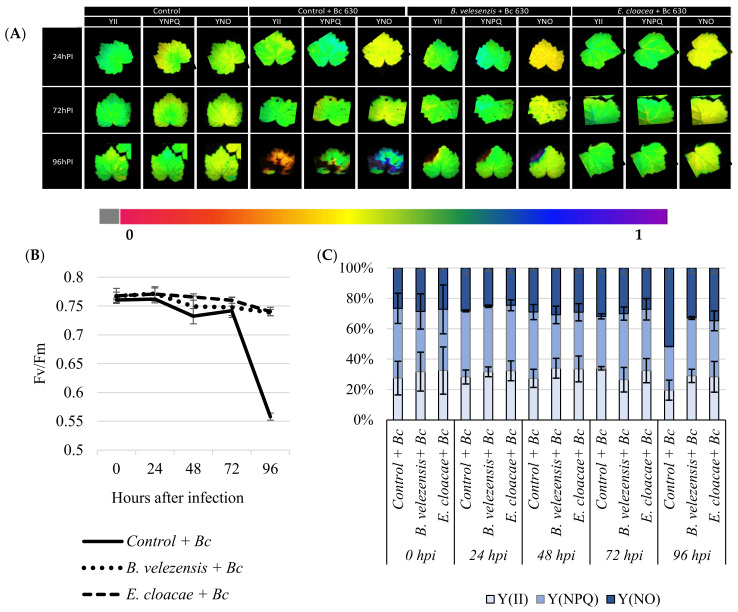
Figure 3.
B. velezensis S3 and E. cloacae S6 prevent grapevines from PSII photo-inhibition four days after infection with B. cinerea. Images of the effective PSII quantum yield Y(II), the quantum yield of regulated energy dissipation Y(NPQ) and of nonregulated energy dissipation Y(NO), from grapevine leaves inoculated or not with B. velezensis S3 and E. cloacae S6 0, 24, 48, 72, and 96 hpi with B. cinerea. The pixel value display is based on a false-color scale ranging from black (0.000) via red, yellow, green, blue, to purple (ending at 1.00). The figure shows representative images of one from two independent experiments (A). Evolution of the maximum PSII quantum yield (Fv/Fm) from grapevine leaves inoculated or not with B. velezensis S3 and E. cloacae S6 0, 24, 48, 72, and 96 hpi with B. cinerea (B). Changes in chlorophyll fluorescence parameters (Y(II), Y(NO), and Y(NPQ)) from grapevine leaves inoculated or not with B. velezensis S3 and E. cloacae S6 0, 24, 48, 72, and 96 hpi with B. cinerea. Excitation flux at PSII in infected leaves (C). Values shown are means ± SD of two independent repetitions (each repetition was realized in triplicates).

