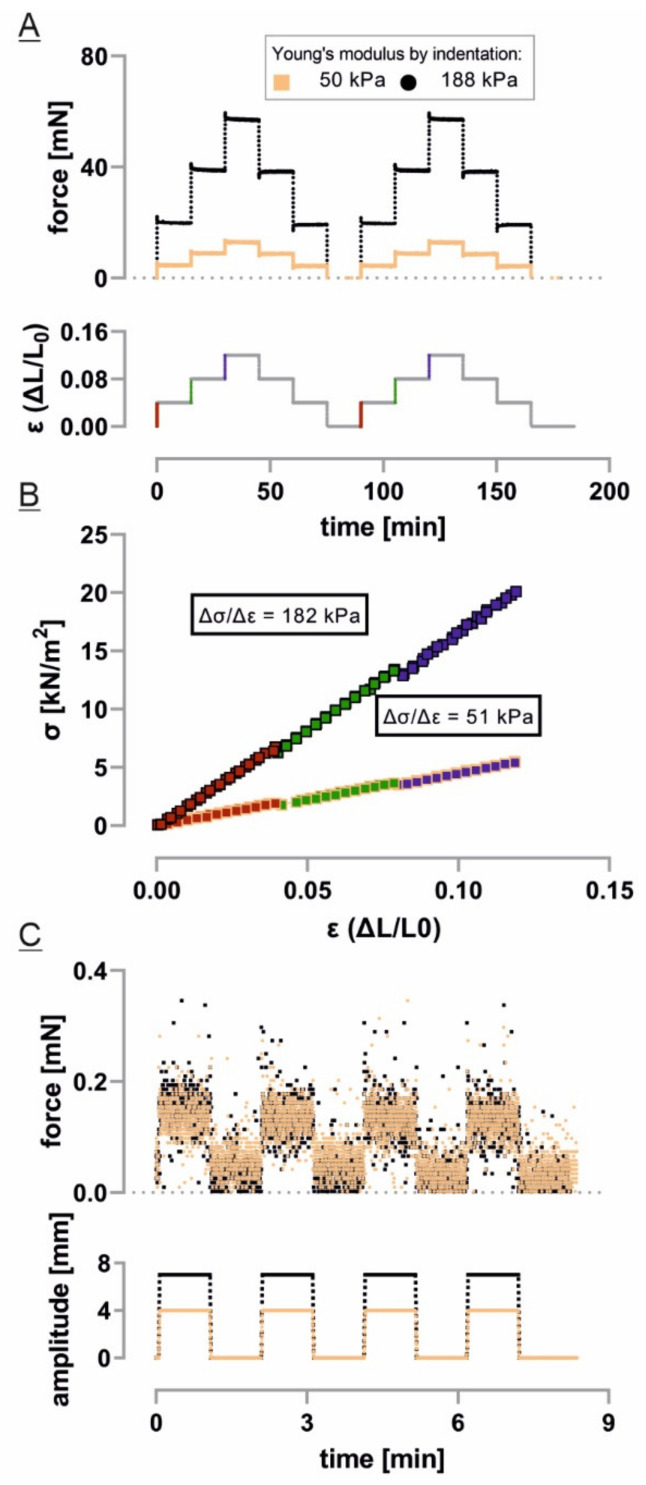
Figure 2.
Setup calibration: (A) Two different elastomer samples of defined geometry and known Young’s modulus were strained stepwise from 0–0.04, 0.04–0.08 and 0.08–0.12. The resulting forces were measured with a rate of 10 Hz; (B) Taking the sample’s dimensions into consideration, the linear correlation of stress and strain enables the calculation of expected Young’s moduli for every step (indicated in red, green and blue, respectively, in (A) and (B)). Stated here is the mean Young’s modulus of all steps; (C) The sensitivity of the setup was shown by measuring the very small buoyancy correction to the force. To this end, the instrument’s needle was raised in liquid without a sample mounted to the amplitudes used in our experiments.

