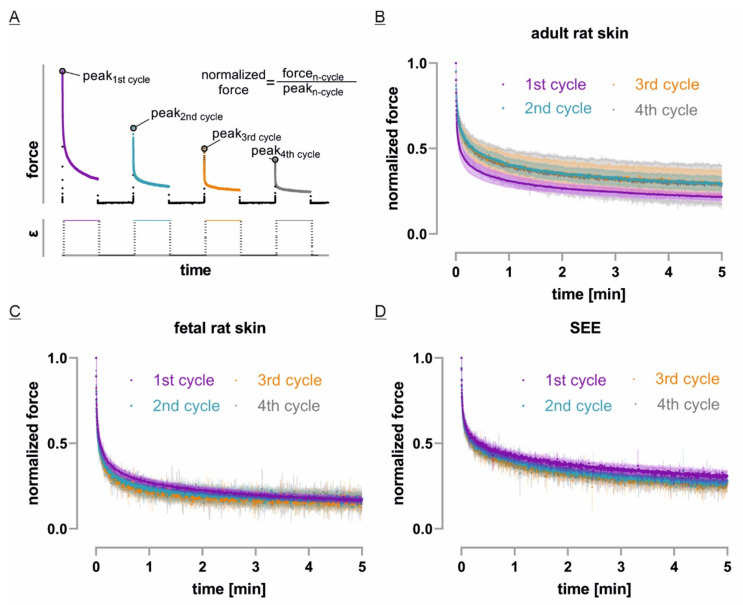
Figure 5.
Tissue stress relaxation during repetitive static stretch and rest cycles: (A) To compare tissue behavior for repetitive cycles, force values of every stretch cycle were normalized to its initial peak force; (B–D) The initial stress relaxation curves for each tissue system were plotted as mean in dark color and SD in bright color over time (fetal: n = 3, adult and SEE: n = 4).

