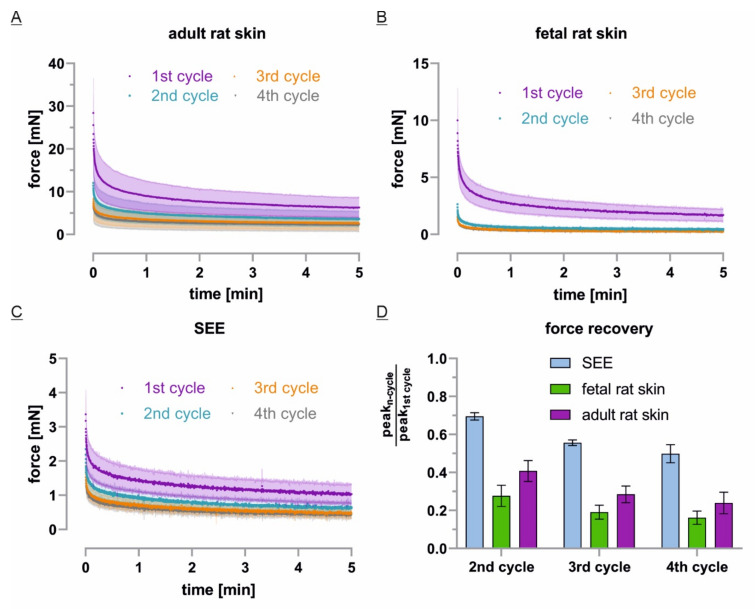
Figure 6.
Tissue force recovery upon repetitive static stretch and rest cycles: (A–C) The initial force decay for each tissue system was plotted as mean in dark color and SD in bright color at relative time scale (fetal: n = 3, adult and SEE: n = 4); (D) The tissue force recovery was calculated as mean and SD of the cycle’s peak force divided by the highest, first peak force value.

