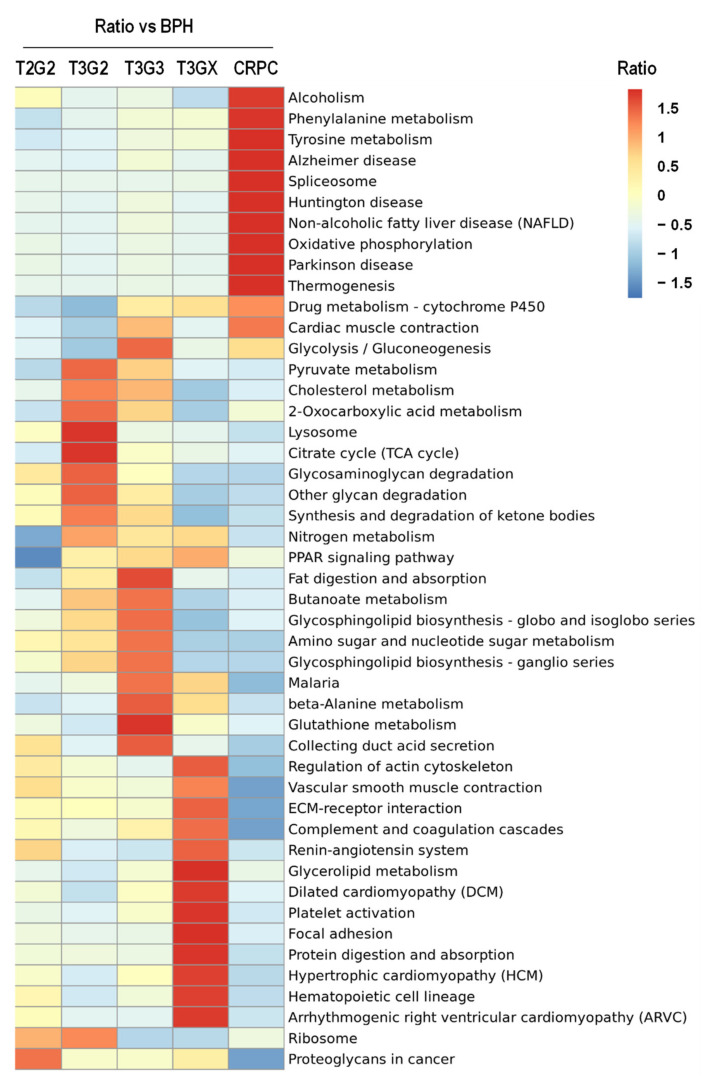
Figure 2.
A comprehensive heatmap for cluster analysis of the enrichment patterns for the Kyoto Encyclopedia of Genes and Genomes pathway. The horizontal axis is the different protein grouping, and the vertical axis is the different functional classification. The red to blue gradient color represents the enrichment p-value (<0.05) of the protein grouping in the specified functional classification. Red represents significant enrichment, while blue represents no significant enrichment.

