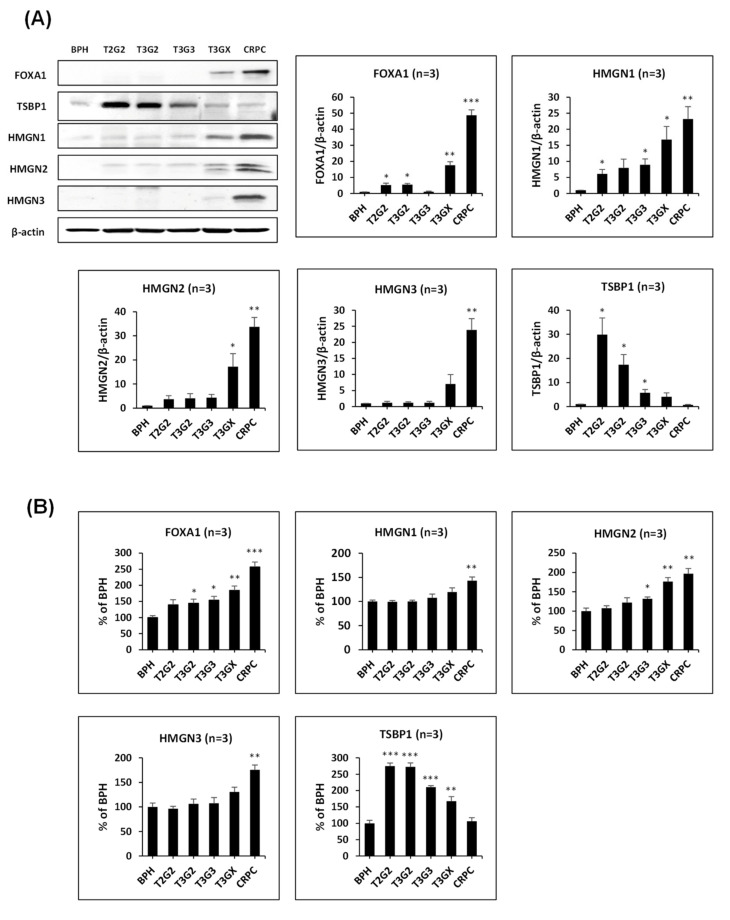
Figure 4.
Validation of STRING predicted functions according to prostate cancer (PCa) stages. (A) Immunoblotting and relative ratio of protein level (n = 3). (B) Relative ratio of different stages of PCa patient tissue compared with the benign prostatic hyperplasia group using enzyme-linked immunosorbent assay (n = 3). * p < 0.05, ** p < 0.01, *** p < 0.001 vs. BPH.

