Figure A1.
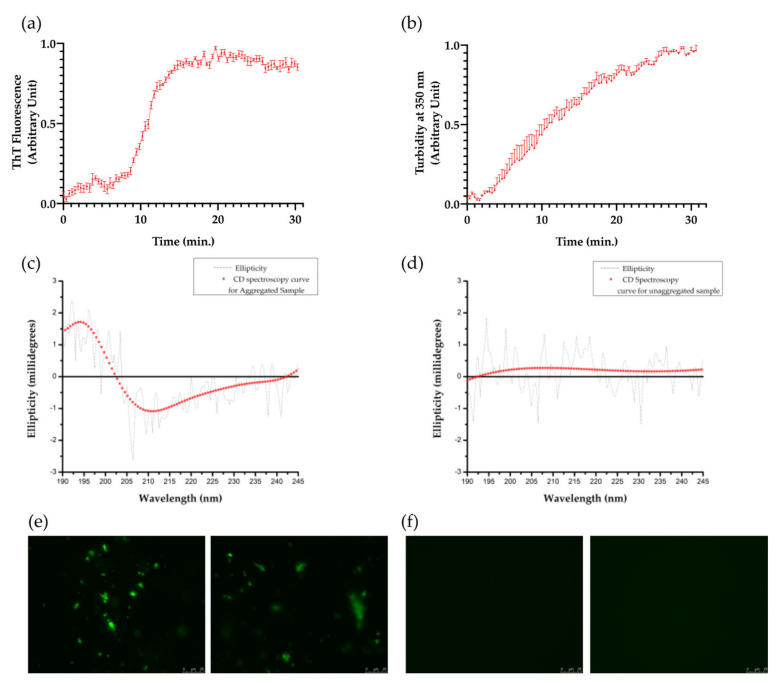
Formation of tau-PHF6 aggregates. (a) ThT fluorescence data depicts the aggregate formation of tau-PHF6 (n = 4) over time. (b) Turbidity measurement assay: Absorbance at 350 nm depicting the formation of aggregated tau-PHF6 species over time. Error bars denote standard error (with n = 4). (c,d) CD spectroscopy curves for aggregated and unaggregated PHF6, respectively. (e) Fibrillization of aggregated PHF6 as observed by fluorescence microscopy (63X) (representative images from two different replicates). (f) Unaggregated PHF6, as observed by fluorescence microscopy (63X) (representative images from two different replicates).

