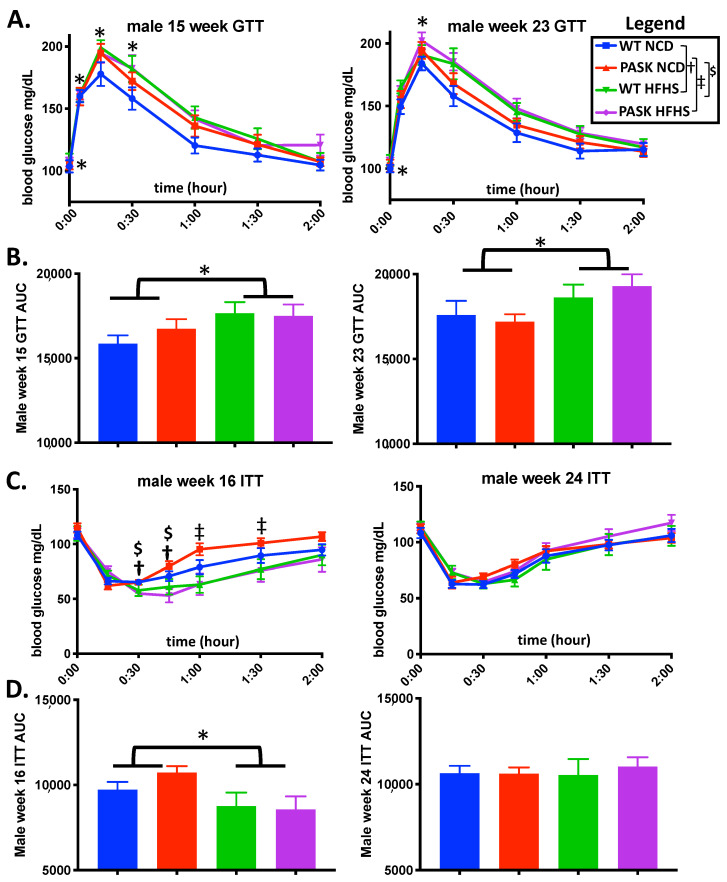
Figure 2.
The HFHS diet effects both GTT and ITT response. (A) Blood glucose levels during IP glucose tolerance testing (GTT) at 15 weeks and 23 weeks on the HFHS diet. (B) Area under the curve (AUC) from (A). (C) Blood glucose levels during IP insulin tolerance testing (ITT) at 16 weeks and 24 weeks on the HFHS diet. (D) Area under the curve (AUC) for (C). All data were analyzed by factorial ANOVA in JMP Pro version 14 with post hoc Tukey HSD analysis to investigate interactions between diet and genotype and post hoc Dunnett’s analysis for either diet and genotype separately when no interaction is seen. P-values less than or equal to 0.065 are shown (WT-NCD compared with WT-HFHS †, NCD compared with PASK-HFHS ‡, NCD compared with WT-HFHS $ and * indicates differences due to diet, namely, all mice on NCD versus all mice on HFHS diet). A corresponding legend is provided in the top right. All groups n = 7.

