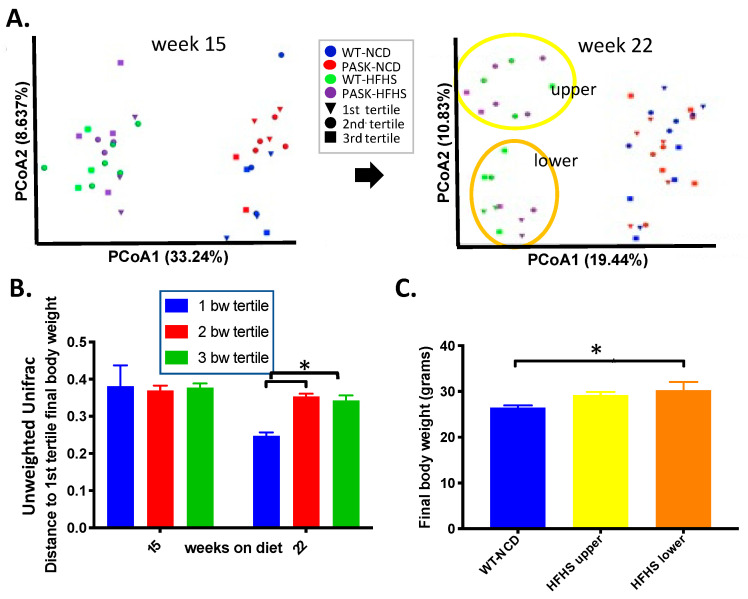
Figure 4.
Gut microbial composition is associated with weight gain on an HFHS diet. (A) Unweighted UniFrac principal coordinates analysis (PCoA) distances in microbial diversity plot of week 15 samples and week 22 samples coded by final body weight tertile per cohort, with oval outline of the HFHS lower cluster (orange) and upper cluster (yellow). (B) Comparison of unweighted UniFrac [54] distances by final body weight tertile of HFHS males at 15 and 22 weeks. (C) Final body weights of HFHS mice divided by unweighted UniFrac PCoA cluster compared to the WT-NCD. QIIME2/2017.10. software package [43] was used to analyze the microbiome and produce (A). ANOVA was performed from (B) summary QIIME2/2017.10. data using GraphPad Prism version 8.0.0 (GraphPad Software, San Diego, CA, USA), and for (C), ANOVA in JMP Pro 14, to determine significance followed by post hoc Dunnett’s analysis for comparison with WT-NCD (p < 0.05 is indicated by “*”).

