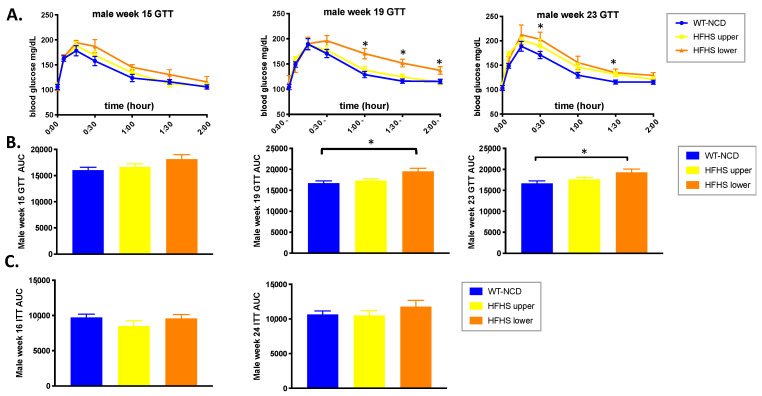
Figure 6.
Gut microbial composition influences glucose response. (A) Week 15, 19 and 23 glucose tolerance test (GTT). (B) Area under the curve (AUC) of the GTT shown in (A) (n = 8–14). (C) Week 16 and 24 insulin tolerance test (ITT) (n = 10–13). ANOVA in JMP Pro version 14 was used to analyze significance with post hoc Dunnett’s analysis to determine significance with respect to the WT-NCD (* indicates p < 0.05).

