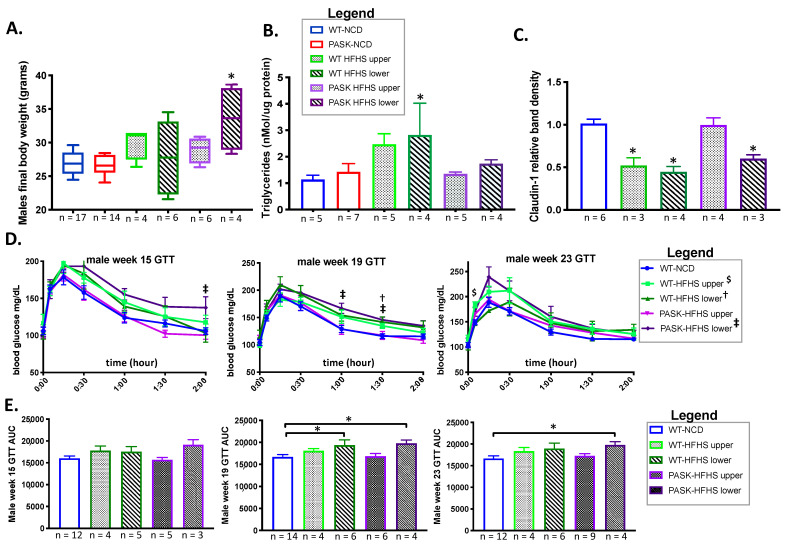
Figure 7.
An interplay between genotype and microbial composition influences weight and glucose response. (A) Comparison of weight gain, (B) triglyceride accumulation, and (C) claudin-1 expression on the high-fat high-sugar diet by unweighted UniFrac PCoA cluster and genotype with sample number provided on the x-axis. (D) Glucose tolerance (GTT) tests at week 15, 19 and 23. (E) Area under the curve (AUC) of the GTT’s shown in (D), with sample number provided on the x-axis. ANOVA followed by post hoc Dunnett’s analysis using WT-NCD as control was performed on all samples, including individual GTT time points (symbols †, ‡, $ for p < 0.051) as well as the AUC (* is used for p < 0.051) using JMP Pro version 14.

