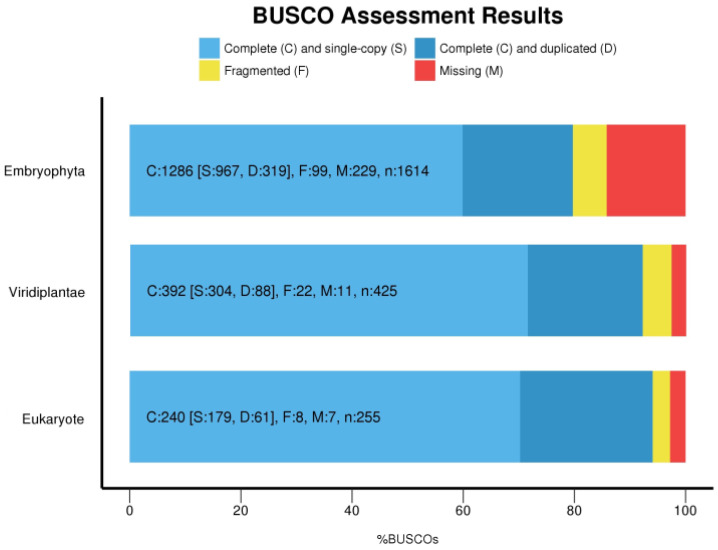
Figure 1.
BUSCO completeness assessments of the V. speciosa filtered transcriptome with the Eukaryote (n = 255 conserved genes), Viridiplantae (n = 425 conserved genes) and Embryophyta (n = 1614 conserved genes) datasets. Blue, yellow, and red bars, respectively, represent the proportion of complete (C), fragmented (F), and missing (M) BUSCO genes. Light blue bars represent complete and single-copy BUSCO genes (S). Dark blue bars represent complete and duplicated BUSCO genes (D). Numbers within bars are absolute numbers of recovered (complete or fragmented) and missing genes. For example, for Embryophyta, the total dataset is composed of n = 1614 genes, of which 1286 (79.7%) were complete, 99 (6.1%) were fragmented, and 229 (14.2%) were not recovered. Among the complete genes, 319 represented duplicated genes and 967 represented single-copy genes.

