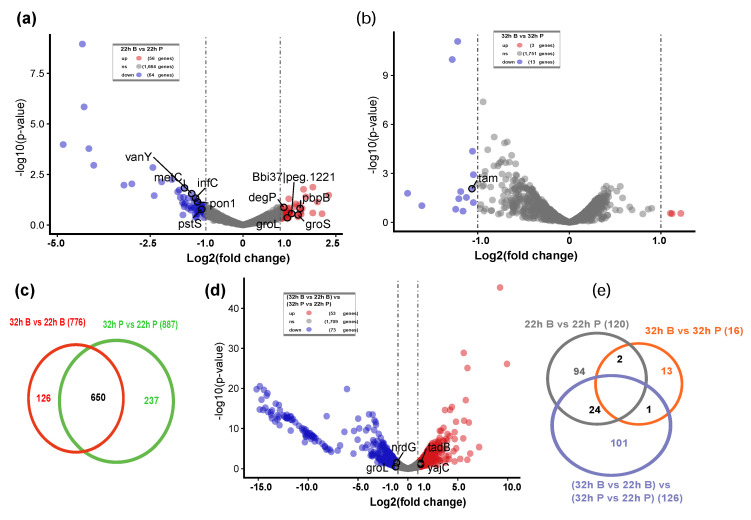
Figure 2.
Transcript profiling changes during B. bifidum FHB150 biofilm formation. (a) The volcano plot showing the DEGs between 22 h B and 22 h P. DEGs: differentially expressed genes. Red points represent upregulated DEGs and blue points represent downregulated DEGs. B: biofilm cells, the group containing wheat fiber. P: planktonic cells, the control group without wheat fiber. (b) The volcano plot showing the DEGs between 32 h B and 32 h P. (c) Venn diagram representing the number of DEGs between 32 h B vs. 22 h B and 32 h P vs. 22 h P. (d) The volcano plot showing the DEGs changes during biofilm formation (22–32 h). (e) Venn diagram representing the number of nonredundant DEGs during biofilm formation.

