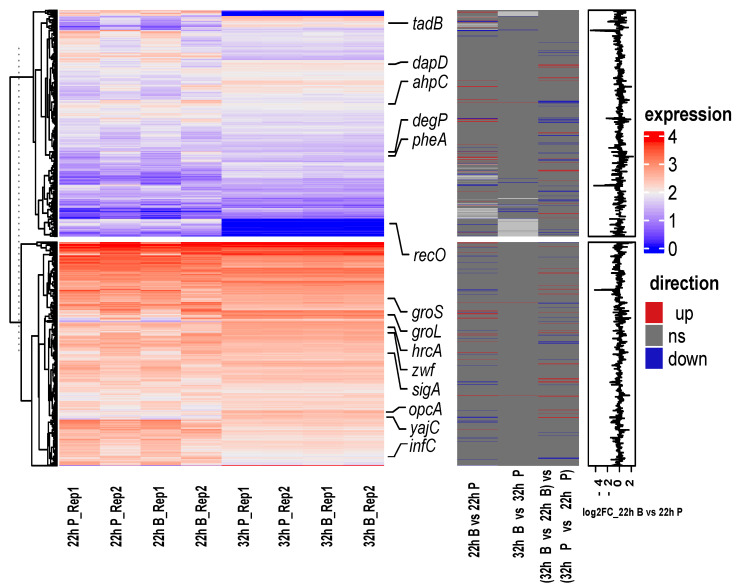
Figure 4.
Gene expression heatmap of B. bifidum FHB150. The left heat map shows the gene expression levels in different samples. Red indicates a higher gene expression level, and blue indicates a lower gene expression level. The color from red to blue indicates log10 (FPKM +1) from high to low. The middle heat map shows the three directions of genes, upregulated, downregulated or ns (no significance). FPKM: fragments per kilobase of exon per million mapped fragments. The right bar graph is the differential expression log2 FC of genes in 22 h B vs. 22 h P. FC: fold change.

