Figure 1.
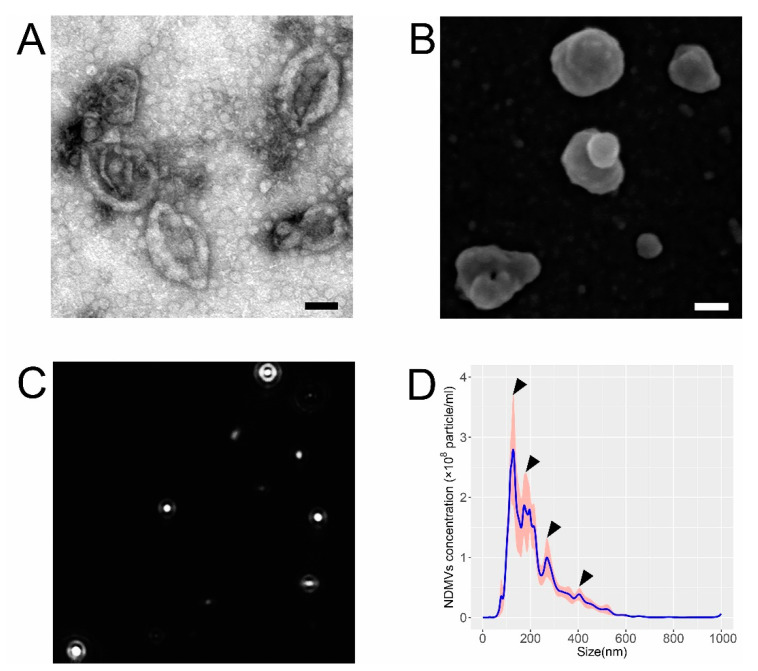
Properties of NDMVs isolated by ultra-centrifugation from TNFα-treated neutrophils. (A) NDMVs displayed a cup-shaped appearance in TEM after visualization by negative staining. (B) NDMVs appear as irregular spheres with a non-smooth surface in SEM. Scale bar in (A,B) = 100 nm. (C) Screenshot of NTA video that records Brownian motion of NDMVs with highlighted white dots for demonstrating particle size and concentration distribution from one sample in one experiment. (D) Size distribution of NDMV size ranging from 100 to 1000 nm after measurements by NTA from 5 separate experiments. The solid line represents the mean concentrations of differently sized NDMVs, with the gray and pink shading showing standard error (SE) of the means (n = 5). Arrows indicate each sub-population.

