Figure 3.
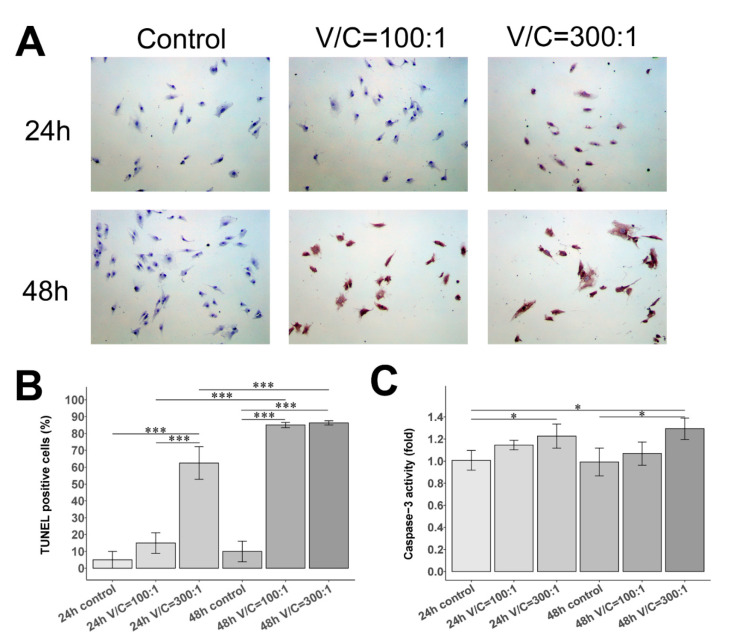
Apoptosis of FLS with NDMV treatment using TUNEL assay and caspase-3 activity assay. (A) Representative images of FLS exposed with and without different vesicle/cell (V/C) ratios of 100:1 or 300:1 for 24 h or 48 h by TUNEL assay; ×100 magnification. (B) The histogram of TUNEL-positive cells. (C) The histogram of caspase-3 activity in control, V/C = 100:1 and V/C = 300:1 groups for 24 h or 48 h. Data are expressed as mean (±SE), n = 3 independent experiments performed in different FLS clones. Significant differences between groups were identified using the Kruskal–Wallis test followed by the Conover–Inman test. * p < 0.05; *** p < 0.001.

