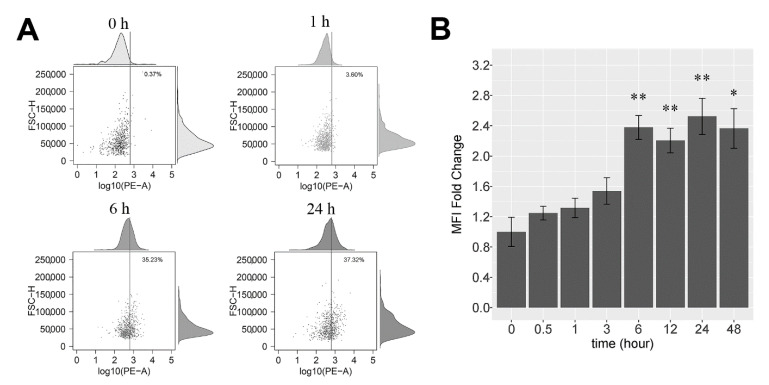
Figure 5.
Measurement of NDMV uptake by flow cytometry: (A) portrays scatter plot of untreated, control FLS, and 1 h, 6 h and 24 h after addition of NDMVs at a ratio of 100. The vertical line is the gating threshold to identify NDMV-negative and -positive FLS. The upper and right panels are density curves of target fluorescence in FLS and cell size. (B) The mean MFI fold change over time of incubation of FLS with labeled NDMVs. Data were normalized to FLS in the absence of NDMVs. Each point represents the mean (±SE) from 5 independent experiments. Significant differences between groups were identified using the Kruskal–Wallis test followed by the Conover–Inman test. * p < 0.05, ** p < 0.01.

