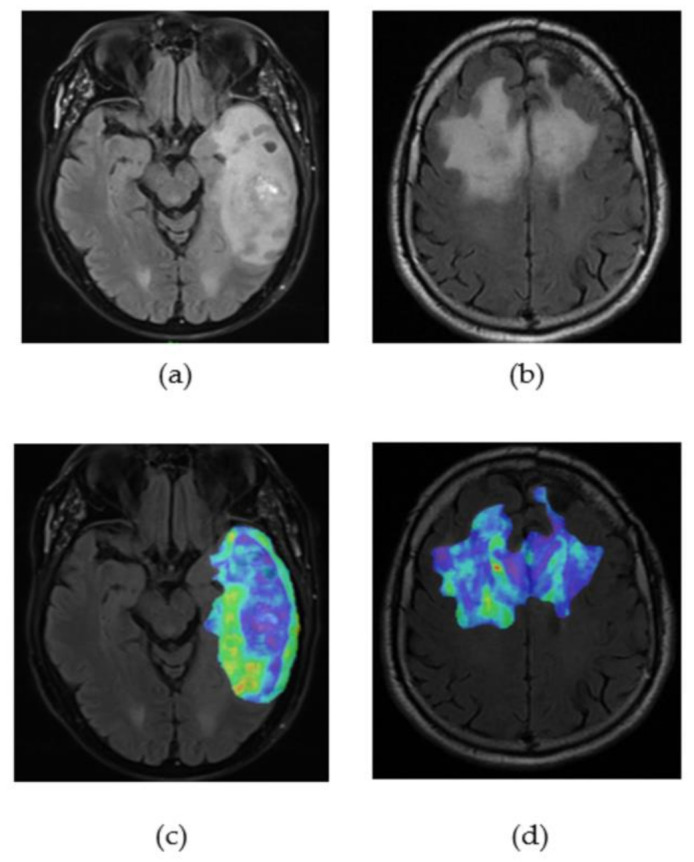
Figure 4.

(a) FLAIR image of glioblastoma’s patient with a bad prognosis (OS = 3 months); (b) FLAIR image of glioblastoma’s patient with a good prognosis (OS = 30 months); (c) original neighbouring grey tone difference in matrix strength radiomic map of the segmented tumour on the patient with bad prognosis; (d) original neighbouring grey tone difference in matrix strength radiomic map of the segmented tumour on the patient with good prognosis.
