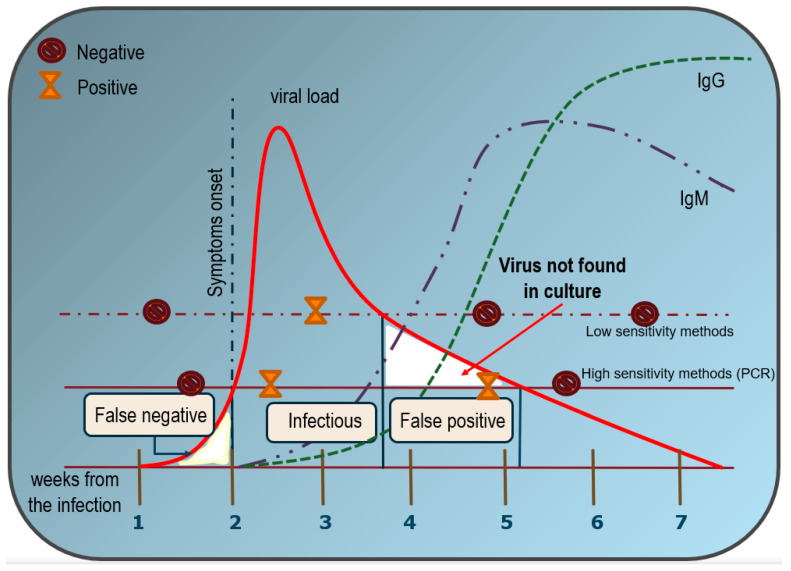
Figure 2.
Estimated over time likelihood of SARS-CoV-2 virus detection with RT-PCR tests and serological assays in respect to symptom onset. The figure has been reconstructed on the basis of several reports and the estimated values are only approximate averages. Viral load shows an asymmetric distribution, with an extended tail. The maximum probability to detect infectious individuals happens after the first week since the infection and lasts for almost three weeks. Since then, it is quite unlikely to identify subjects that could truly transmit the disease. As a consequence, no virus development occurs in culture from biological samples in which RT-PCR positivity has been ascertained when the cycle threshold is very high (a Ct < 30 is suggested, but it may vary depending on the swab procedure accuracy). Unlike low-sensitivity methods (dashed line), the high sensitivity of the RT-PCR method could therefore lead to disclosing more positives that, on the other hand, are not contagious (solid line). Conversely, false-negative results may occur during the first week, when active viral replication does not reach the sensitivity level required by the RT-PCR test. For comparison, serological analysis shows a steady increase in both IgM and IgG values only after 4–5 weeks. Thereafter, IgM progressively decreases after 7–8 weeks, whereas IgG still persists for several months.

