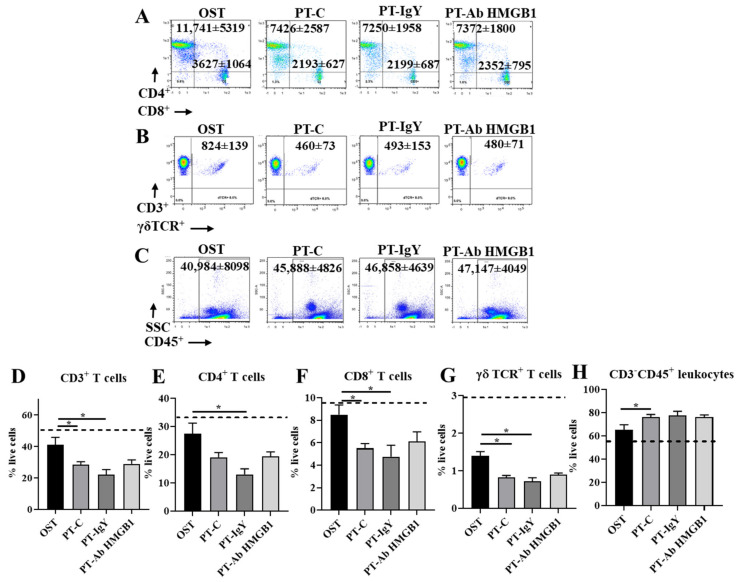
Figure 6.
Flow cytometry representative dot plots with mean cell counts ± standard deviation for (A) CD3+CD4+ and CD3+CD8+ T cells; (B) CD3+γδTCR+ T cell counts; (C) CD3−CD45+ leukocytes in blood at 1, 3 and 7 days post-trauma (dpt) in osteotomy (OST; n = 10), polytrauma (PT-C; n = 10), polytrauma + IgY (PT-IgY; n = 5 for 1 and 3 dpt; n = 4 for 7 dpt) and polytrauma + anti-HMGB1 antibody (PT-Ab HMGB1; n = 10) rats; (D) percentage (%) CD3+ T cells; (E) % CD3+CD4+ T cells; (F) % CD3+CD8+ T cells; (G) % CD3+γδTCR T cells; and (H) % CD3−CD45+ leukocytes in blood from rats with OST, PT-C, PT-IgY and PT-Ab HMGB1 at 1, 3 and 7 dpt. Naïve uninjured rats were used as baseline controls (n = 5). The dotted line is the mean of cell counts from naïve rats. * p < 0.05 comparing OST, PT-C, PT-IgY and PT-Ab HMGB1 cohorts. The bar graphs represent mean, whereas error bars represent SEM.

