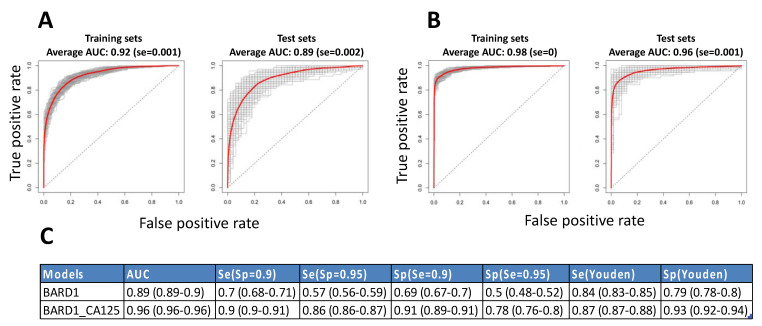
Figure 2.
Cross-validations for BARD1 models based on 20 peptides without or with CA125 included. For cross-validation, antibody binding data for 480 samples were randomly and proportionally split 200 times in 3⁄4 for training sets (187 cancers, 133 controls) and 1⁄4 validation sets (93 cancers, 67 controls). Lasso modelling was performed on antibody binding data of each of the 200 training sets and applied on complementary validation sets: (A) the respective ROC curves obtained for models of 200 training and 200 (left) validation sets (right) are presented and average ROC curves are marked red; (B) the respective ROC curves obtained for 200 training (left) and validation sets (right) for BARD1-CA125 models are presented and average ROC curves are marked red; (C) the specificity and sensitivity values for average ROC curves of test sets are shown for different cut-offs for BARD1 and BARD1-CA125 models. The 95% confidence intervals are shown in brackets.

