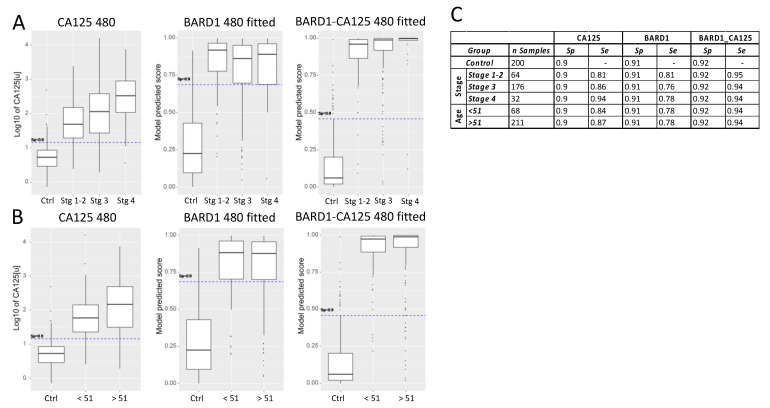
Figure 3.
Sensitivity analysis of CA125, BARD1 480-sample-fitted model, and BARD1-CA125 480-sample-fitted model for different ovarian cancer stages: (A) the CA125 values (log10 scale) or the scores predicted by BARD1 480-sample-fitted and BARD1-CA125 480-sample-fitted models are shown for controls and cancer stages. The cut-off was fixed at specificity 0.9 (dashed line); (B) comparison of sensitivity of CA125, BARD1 480-sample-fitted model, and BARD1-CA125 480-sample-fitted model by age group of <51 and >51 (51 and more); (C) the specificity and sensitivity values for groups of age are shown for specificity =0.9 cut-off.

