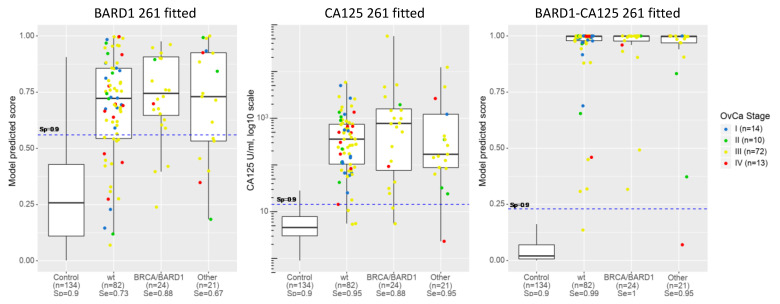
Figure 5.
BARD1 261-sample-fitted model, BARD1-CA125 261-sample-fitted model, and CA125 applied to ovarian cancers with or without mutations. Comparison of model prediction score of BARD1 261-sample-fitted model, CA125, and BARD1-CA125 261-sample-fitted model applied to healthy controls (Control), ovarian cancers without known mutation (wt), with BRCA1/2 and BARD1 mutations (BRCA/BARD1), and with other than BRCA1/2 or BARD1 mutations (Other). Prediction scores or concentration (CA125) are presented as dots for each sample and as boxplots. Sensitivity (Se) is shown for controls and each group of ovarian cancers under each label. Distribution of cancer stage (I to IV) is indicated by colour code for each group.

