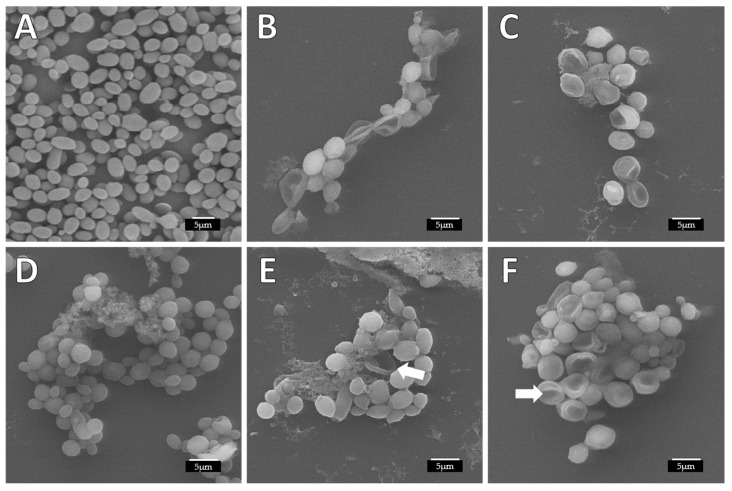
Figure 3.
Alterations produced in C. albicans biofilm structure and cell morphology during the biofilm formation treatment observed by SEM. (A) Untreated; (B) ArCO2G2(SNMe3I)4 (2) dendron alone to 8 mg/L (C) AgNO3 alone to 8 mg/L; (D) EDTA alone to 32 mg/L; (E) combination ArCO2G2(SNMe3I)4 (2):AgNO3 to 8:4 mg/L; (F) combination ArCO2G2(SNMe3I)4 (2):EDTA to 8:32 mg/L (white arrow: collapsed cells).

