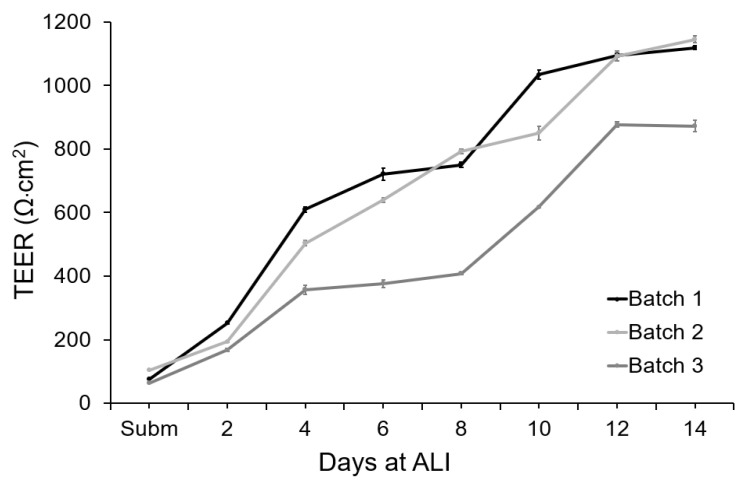
Figure 6.
TEER measurements performed with the concentric electrodes integrated in the BoC device and an EVOM system. Measurements were performed from day 0 (submerged conditions) to day 14 at ALI for 3 different batches of FTSm grown on-chip (N = 3 and n = 1). Data represent the average TEER values registered during a 10 min measurement for each point. Data dispersion during this period was used to calculate the standard deviation. Error bars represent mean ± standard deviation.

