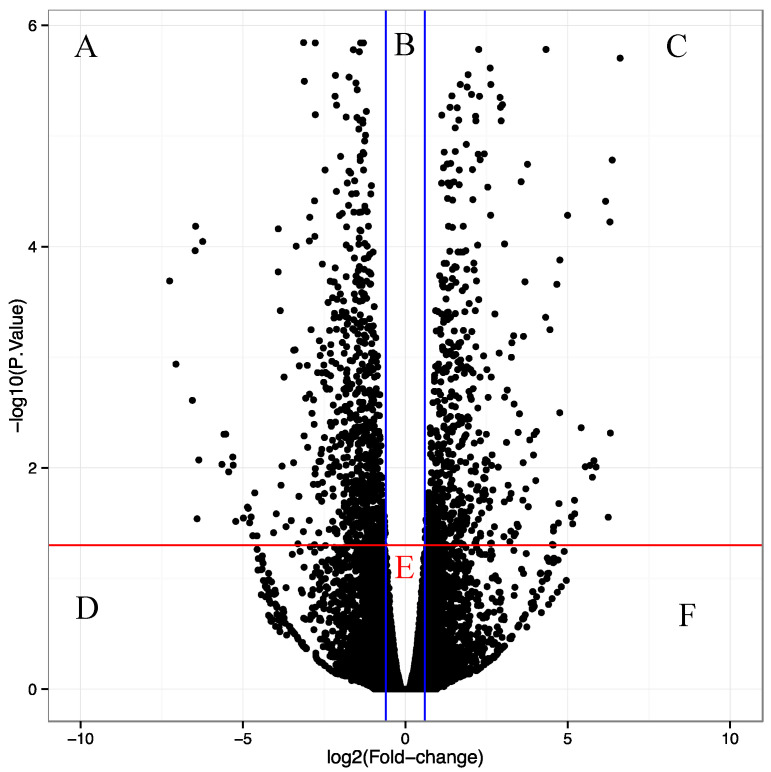
Figure 4.
Volcano plot showing 14,708 genes obtained in the transcriptomes, mapped within the A. thaliana genome. The base 2 logarithms of the fold change are shown on the X-axis. The negative value of the base 10 logarithms of the “p” value is shown on the Y-axis. Thus, the blue lines parallel to the Y-axis represent a “fold change” value = 1.5, and the red line parallel to the X-axis represents a “p” value = 0.05. The A and C sections are the only ones that include the differentially expressed genes (p ≤ 0.05 and “fold change” ≥ 1.5).

