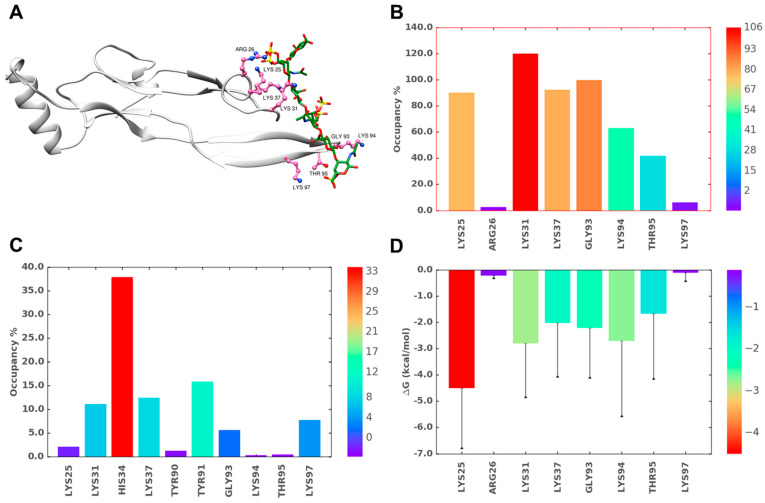
Figure 6.
MD simulation of the TGF-β2–CS06 interaction at binding site I (BS1). (A) A representative structure from the MD trajectory showing the hydrogen bonds (H-bonds) between TGF-β2 residues (hot pink; ball and stick representation) and CS06 (green sticks). The protein ribbon is shown in light grey. (B) Inter-molecular H-bond formation in terms of % occupancy (proportion of MD frames showing direct H-bonds) for residues of BS1. (C) Proportion of water-mediated H-bonds (i.e., occupancy) between TGF-β2 for residues in BS1 and CS06. (D) Single-residue energy decomposition (SRED) values for the TGF-β2–CS06 complex for residues of BS1. Error bars show standard deviation. For ease of interpretation, values from lower to higher are represented by rainbow color (blue→red).

