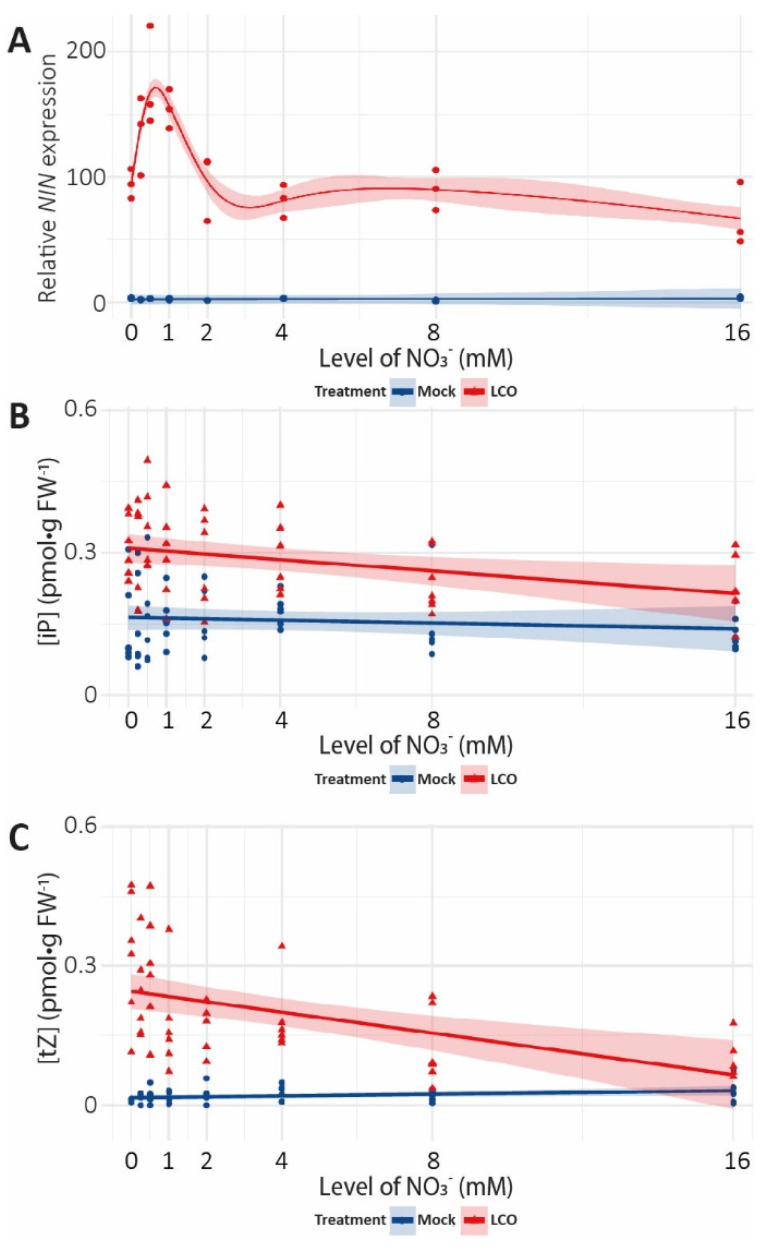
Figure 2.
The effect of increasing levels of nitrate on LCO-induced NIN expression and cytokinin accumulation in the root susceptible zone of wild-type M. truncatula treated with mock or LCO for 3 h. (A) Relative NIN expression (n = 3); red (LCO) and blue (mock) dots indicate individual observations (statistics Supplementary Table S1). (B,C) Concentrations of (B) iP and (C) tZ were measured per gram of fresh weight using UPLC–MS/MS (n = 6); red triangles (LCO) and blue dots (mock) indicate individual observations. (A–C) Coloured line indicates average; coloured shading indicates 95% confidence interval (statistics; Supplementary Table S2).

