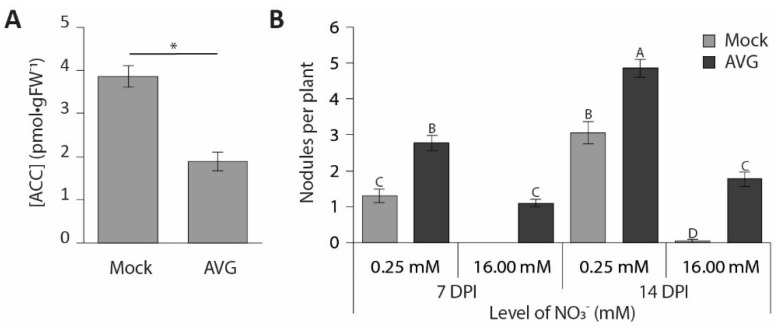
Figure 6.
The effect of AVG application on the M. truncatula root. (A) ACC measurements in the M. truncatula root susceptible zone after 7 days of AVG application (n = 6). (B) Effect of AVG application on nodulation at 0.25 and 16 mM NO3− (n = 40). Bars represent means ± SE. Bars labelled with different letters or an asterisk (*) differ significantly (p < 0.05).

