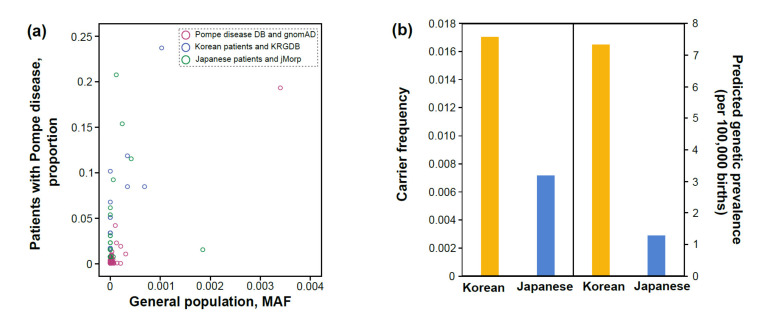
Figure 4.
(a) Scatterplot of the proportion of certain (likely) pathogenic variants among all (likely) pathogenic variants found in total patients considering the frequency of detection (Y) and the minor allele frequency of those variants in a general population database (X). Purple line circles for patients found in the Pompe disease GAA variant database (Pompe disease DB), blue line circles for Korean patients, and green line circles for Japanese patients; (b) carrier frequency and predicted genetic prevalence for Pompe disease in Koreans and Japanese.

