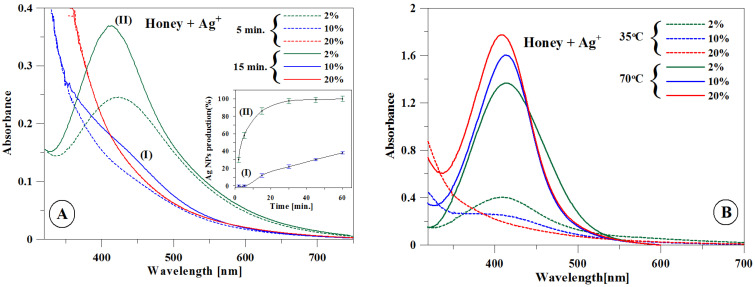
Figure 1.
(A) Ultraviolet–visible (UV–Vis) spectra of silver nanoparticles (AgNPs) recorded after 5 (dotted line) and 15 min (solid line) for the 2%, 10%, and 20% concentrations at 35 °C. Inset: Changing rate of production of AgNPs measured by changes in absorbance at 400 nm with time. (B) Spectra for the 2%, 10%, and 20% concentrations recorded at 35 °C (dotted line) and 70 °C (solid line) after 1 h.

