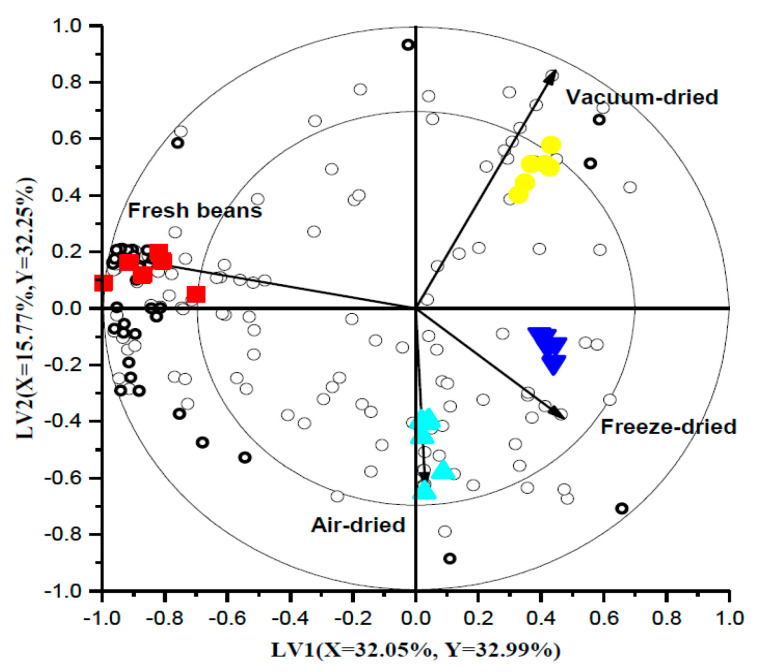
Figure 5.
PLS-DA bi-plot of the headspace fraction of cooked (■) and rehydrated air-dried (▲), vacuum-dried (●) and freeze-dried (▼) beans. The open circles are the volatile compounds among which the discriminant compounds are marked in bold. The correlation loading for the Y variable is represented by the vector. The percentages of X and Y variance explained by each latent variable are indicated on the respective axes.

