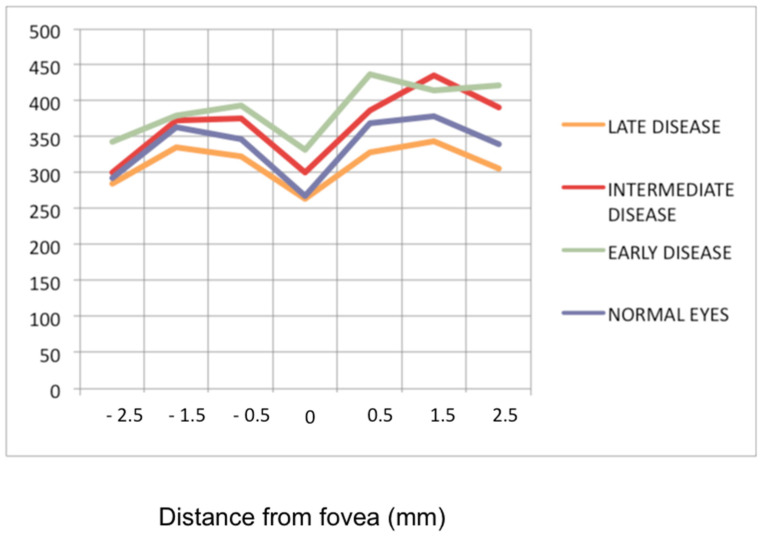
Figure 7.
Progression of retinal disease as followed by optical coherence tomography (x axis indicates distance from fovea (=0); y axis indicates thickness of retina in microns). Early disease (green line) features thickening of the retina (and to a lesser degree the fovea). In late disease (yellow line) there is diffuse thinning except in the fovea; foveal thickness remains comparable to normal (purple line) (from Ophthalmic Surg Lasers Imaging 2012; 43-suppl S25–31).

