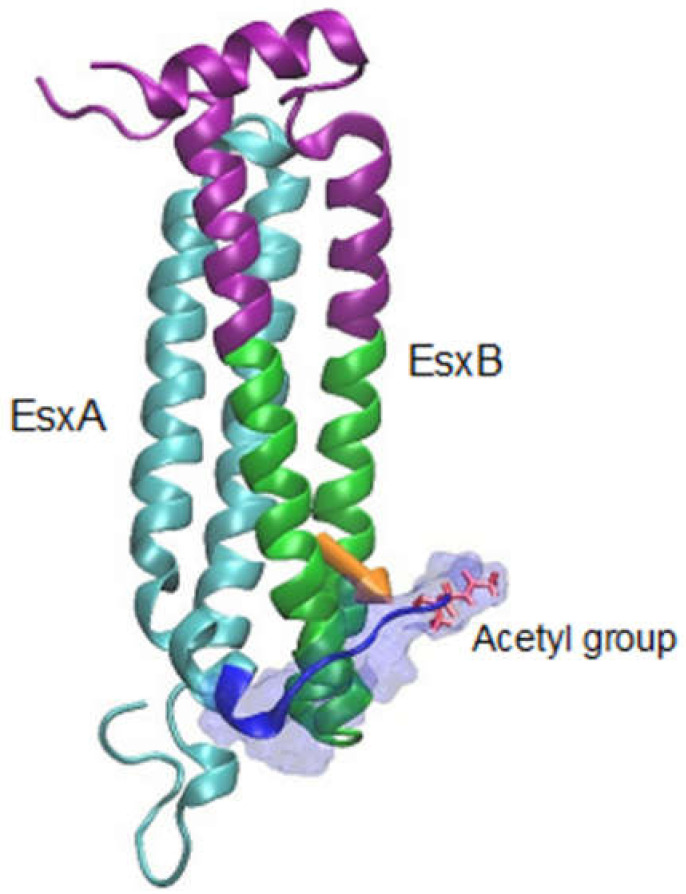
Figure 2.
Interaction between the Nα-acetylated EsxA and EsxB at pH 4. The structure of Mtb EsxAB heterodimer with Nα-acetylation was analyzed by molecular dynamic simulation. The figure was generated from snapshots of 20 ns molecular dynamic (MD) simulations at pH 4. EsxA is colored in cyan; the N-terminus of EsxA is colored in blue and shown in transparent surface representation. The acetylated Thr-2 residue is shown in bond representation and colored in red. The residues in EsxB within 20 Å of the N-terminus of EsxA are colored in green, and the residues beyond 20 Å are shown in purple. The orange arrows represent the electrostatic interaction between two sets of residues: the residues in the N-terminus of EsxA (blue) and the residues in EsxB within 20 Å of the N-terminus of EsxA (green). The MD simulation shows that the acetylated N-terminal arm of EsxA makes direct contracts with EsxB in a frequent “bind-and-release” mode, which generates a force of 44 pN to pull EsxB away from EsxA. The figure is modified from [86].

