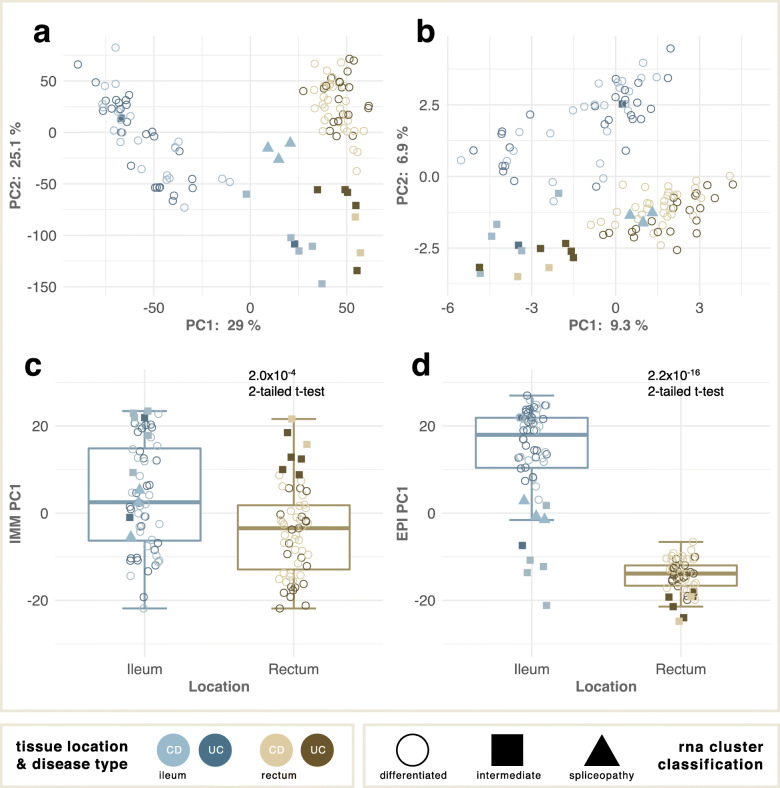
Fig. 1.
Principal components of transcript variation. a PC2 vs PC1 of transcript abundance showing separation of ileal (blue, n = 60) and rectal (brown, n = 59) samples along PC1, and of intermediate samples (solid squares) along PC2. Six of 8 intermediate individuals are represented by two samples each; different individuals are intermediate in the two tissues. b PC2 vs PC1 of exon usage (PSI) showing similar separation by tissue, but with three ileal samples (blue triangles) clustering with the rectal set. Percentages refer to variance explained, shading to disease status. c, d Differential abundance of immune (c) and epithelial (d) cell contributions summarized by PC1 of compartment-specific gene expression differentiate ileum and rectum

