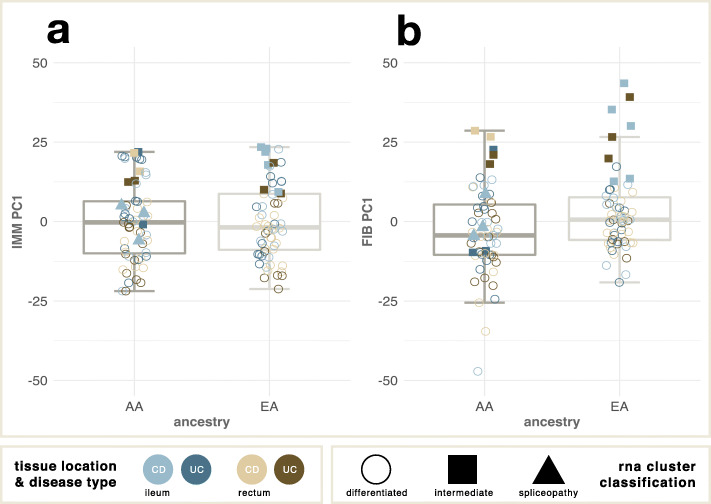
Fig. 3.
Association of ancestry with tissue proportion in biopsies. a PC1 of immune-specific expression is similar between the two ancestry groups. b PC1 of fibroblast-specific expression is significantly different between the two ancestry groups, implying a reduced proportion of fibroblasts in the African ancestry biopsies (p = 0.005, 2-tailed t test). Note that the aberrant intermediate samples have particularly elevated fibroblast expression in both groups, whereas the two “spliceopathy” cases, both African American, have relatively normal fibroblast proportions

