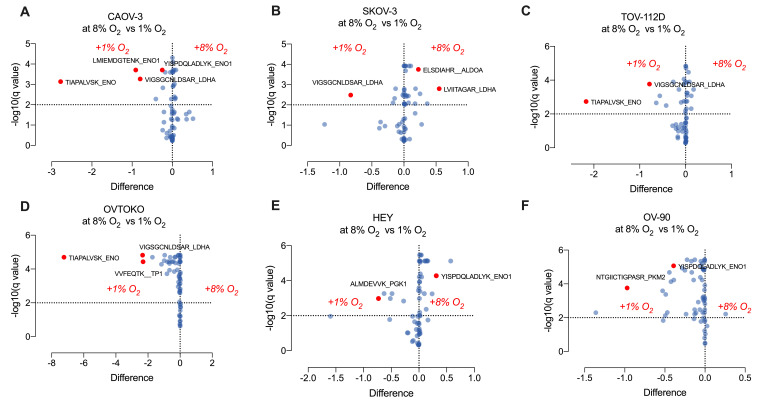
Figure 6.
Relative quantification of the glycolysis proteome in ovarian cancer cells in response to oxygen tensions. Ovarian cancer cells were cultured under 8% or 1% oxygen, and the protein abundance associated with glycolysis were quantified using a targeting mass spectrometry approach. (A): CAOV-3; (B): SKOV-3; (C): TOV-112D; (D) OVTOKO; (E) HEY; and (F) OV-90. Volcano plots show the differences in peptides associated with proteins representatives of glycolysis proteome in cells cultured at 8% compared with cells cultured at 1% oxygen.

