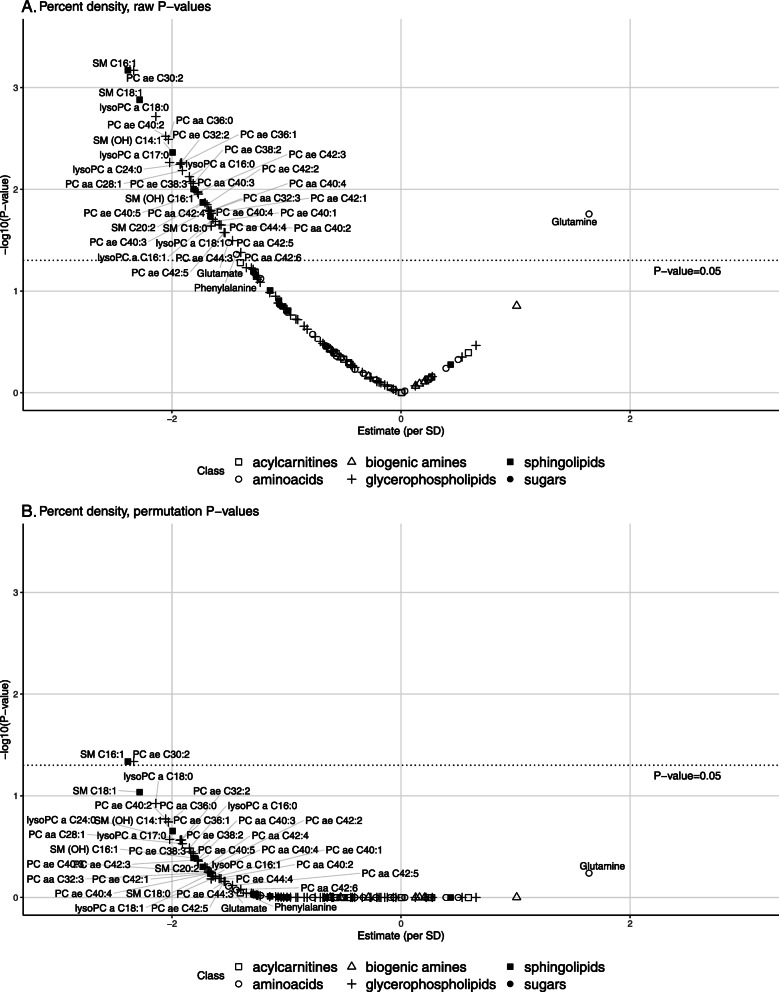
Fig. 1.
Associations between metabolites and percent mammographic density (PMD). A Raw P values. B Adjusted P values. Estimates per standard deviation increase in residuals of metabolites on batch were obtained from linear regression adjusted for age, BMI, age at menarche, family history of cancer, history of benign breast disease, use of oral contraceptive, number of full-term pregnancies, age at first full-term pregnancy, breastfeeding, alcohol intake, smoking status, socioeconomic status, and physical activity. Dotted lines represent statistical significance thresholds for raw P values (A) and for P values adjusted by permutation-based stepdown minP (B). ae, acyl-alkyl; aa, acyl-acyl; PC, phosphatidylcholine; SM, sphingomyelin; SD, standard deviation

