Figure 2.
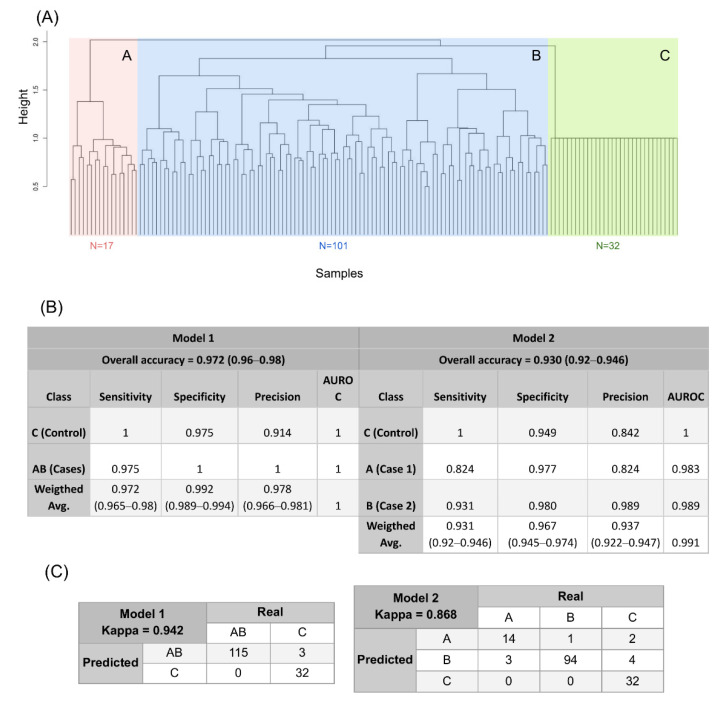
Genomic taxonomy of ovarian failure. (A) Dendrogram obtained from unsupervised clustering of case and control individuals. Three clusters are distinguished: clusters A (red, n = 17) and B (blue, n = 101) group case individuals into two distinct genomic profiles, while cluster C (green, n = 32) contains all control individuals. Genomic distance is represented by height for all groups, with a greater height indicating a larger difference between groups. (B) Prediction performance parameters. Parameters were obtained after executing a random forest algorithm 100 times, with 500 trees created in each iteration with 10-fold stratified cross-validation. Parameters are shown for model 1 (left) and model 2 (right), with the corresponding values of accuracy, sensitivity, specificity, precision, and ROC area obtained for each class and a weighted average in total. Kappa statistic for each model also is shown. (C) Prediction performance confusion matrices. A matrix is shown for model 1 (left), where controls (group C) were distinguished from cases (groups A, B). All 32 controls were correctly classified in cluster C, but three cases were misclassified. A matrix for model 2 (right) distinguishing the two genomic profiles for ovarian failure (groups A and B), with all controls correctly classified (group C) and 10 cases incorrectly classified as either controls or the other subtype. AUROC = area under ROC curve.

