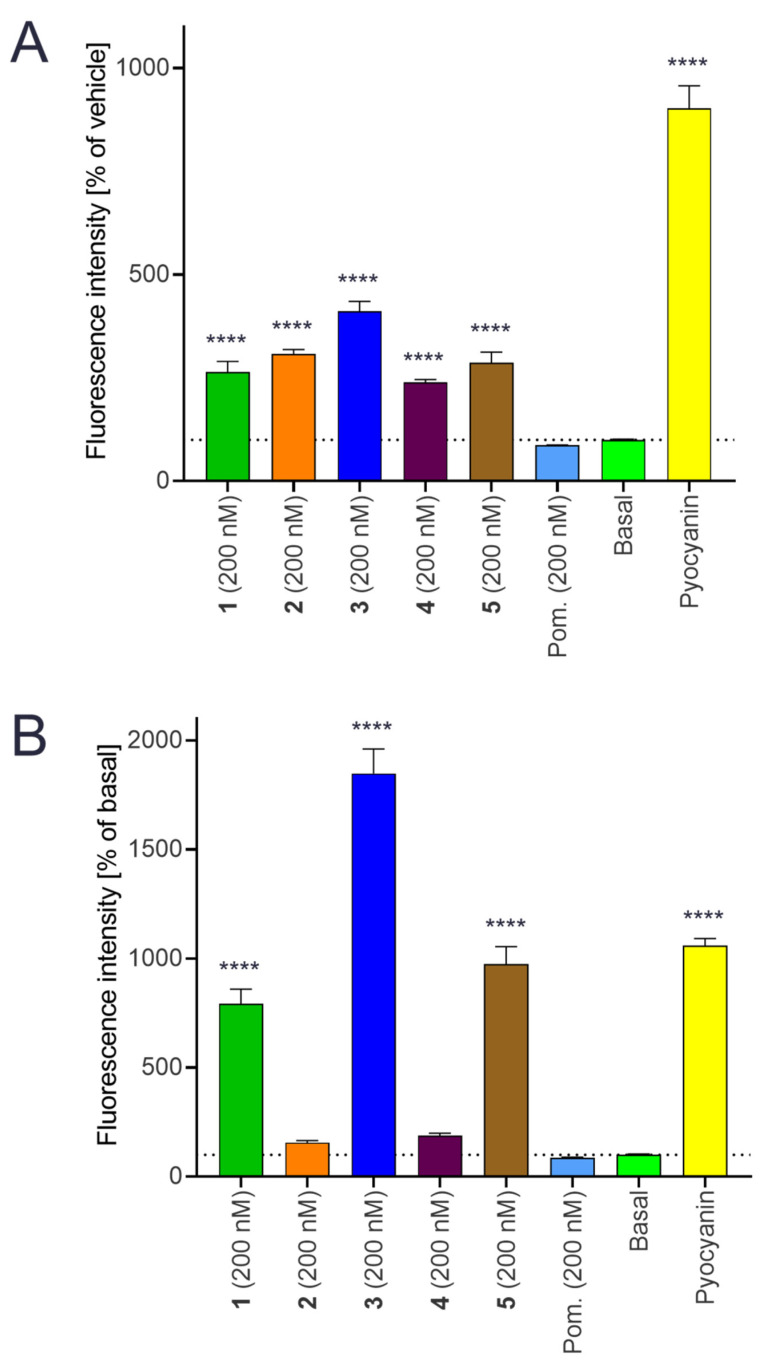
Figure 10.
Effect of the complexes 1–5 on the ROS production in THP-1 cell line. The cells were treated with the complexes 1–5 (200 nM), pomiferin (Pom.; 200 nM), Pyocyanin (100 µM) or only with vehicle (basal) for 1.5 h (A) or 23.5 h (B). Then DCF-DA probe was loaded to cells and after another 30 min, the fluorescence was measured. Graph represents mean ± SEM. Dotted line show the value of basal group. **** indicates statistical significance (p ≤ 0.0001) to basal group.

