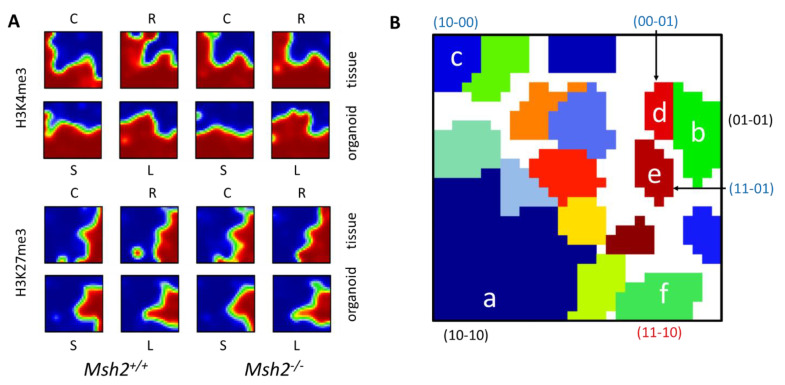
Figure 2.
SOM analysis of histone modification states. The analysis integrates the organoid ChIP-seq data presented in this study and published ChIP-seq data on intestinal tissues [13]. (A) SOM portraits of all samples (C = control, R = radiated, S = short-term and L = long-term culture). (B) Gene clusters with specific regulations. Small letters (a–f) indicate the correlation clusters discussed in the text. The modification states of the cluster-associated genes in the tissue and organoids are indicated in parentheses.

