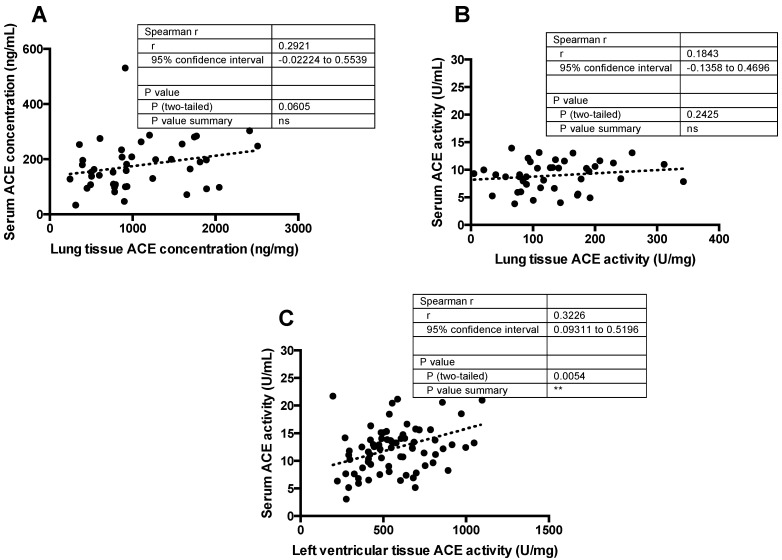
Figure 3.
Correlation between circulating and tissue ACE levels in the same patient samples. Serum ACE concentration or activity was plotted as the function of the ACE concentration (A) or activity (B) in lung tissue homogenates or ACE activity in the left ventricle of explanted human heart tissue samples (C). The parameters of Spearman’s correlation are shown in the table inserts (“ns” means no significant correlation, asterisks represent the presence of a statistically significant correlation). Each symbol represents the value determined for an individual patient. The linear fits represented by the dotted lines in the graphs show the trendlines.

