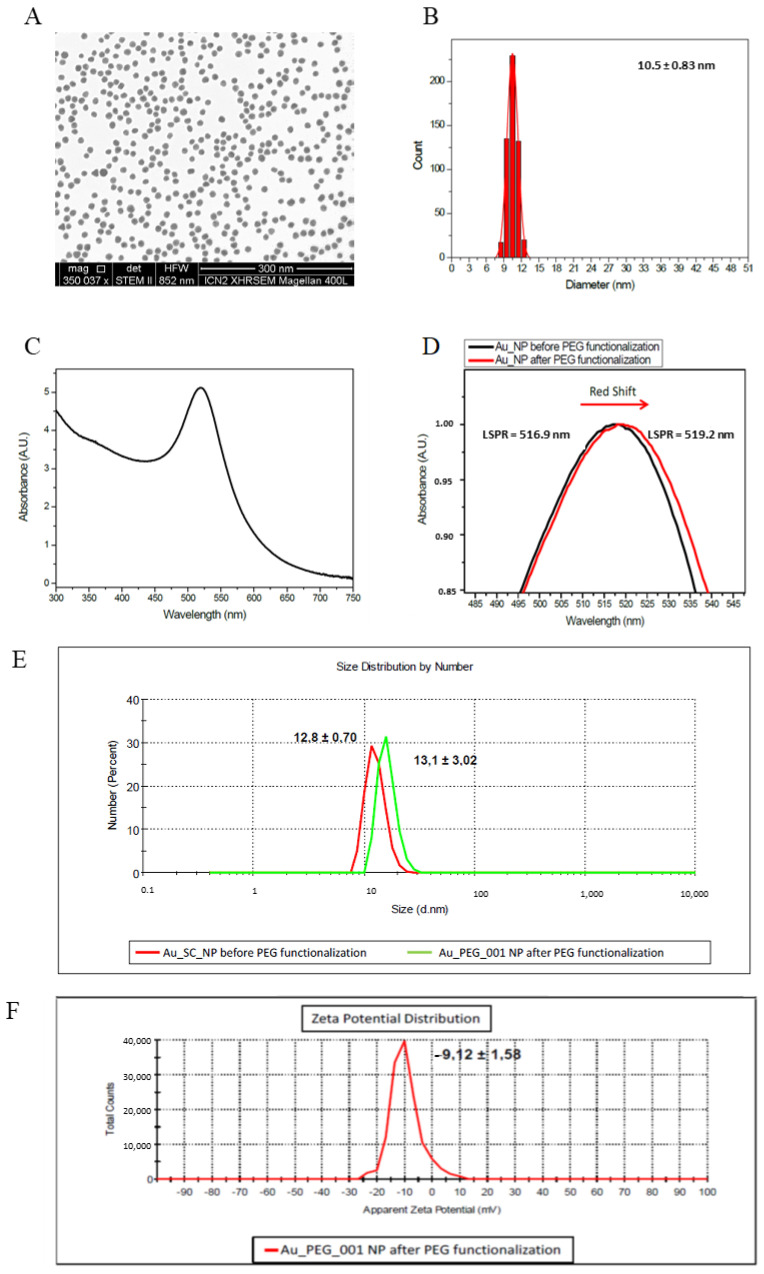
Figure 1.
Basic characteristics of PEG-AuNPs. (A) TEM image of PEG-AuNPs; the bar represents 300 nm; (B) corresponding histograms of size distribution, (C) UV-vis spectra of the colloidal AuNPs suspension; (D) localized surface plasmon resonance (LSPR) of PEG-AuNPs; (E) hydrodynamic diameters measured by dynamic light scattering (DLS) for AuNPs and PEG-AuNPs, (F) zeta potential distribution of PEG-AuNPs.

