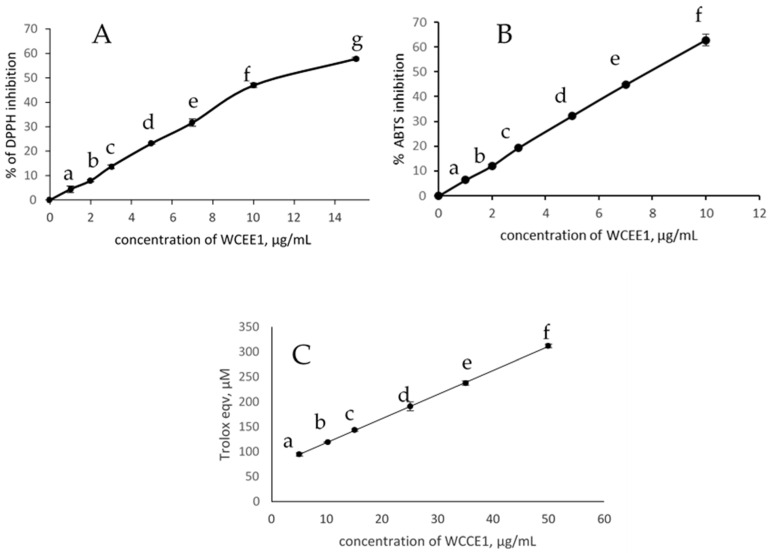
Figure 3.
(A) DPPH radical scavenging activity, (B) ABTS radical scavenging activity, (C) Ferric reducing antioxidant power of WCCE1. Values represent mean ± SD of three replicates. Different letters in the data (a, b, c, d, e, f, g) against each concentration indicate that they are significantly different (p < 0.05).

