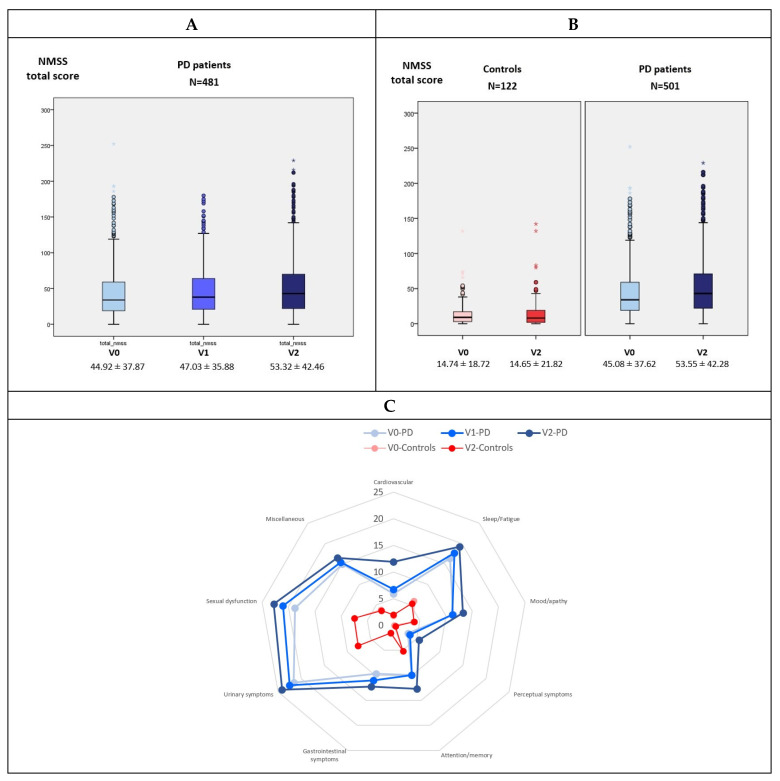
Figure 1.
(A) Mean NMSS total score at V0 (baseline), V1 (1 year follow-up ± 1 month), and V2 (2-year follow-up ± 1 month) in PD patients (N = 481). V1 vs. V0, p < 0.0001; V2 vs. V1, p < 0.0001; V2 vs. V0, p < 0.0001; All groups; p < 0.0001. (B) Change from V0 to V2 in the mean NMSS total score in PD patients (N = 501) and controls (N = 122). V2 vs. V0 in controls, p = 0.944; V2 vs. V0 in PD patients, p < 0.0001; difference in the change from V0 to V2 between PD patients and controls, p = 0.002. (C) Mean score on each domain of the NMSS scale at V0, V1, and V2 in PD patients (blue) and controls (red). Data (A and B) are presented as box plots, with the box representing the median and the two middle quartiles (25–75%). P values were computed using general linear models (GLM) repeated measures. Mild outliers (O) are data points that are more extreme than Q1 − 1.5 × IQR or Q3 + 1.5 × IQR. NMSS, Non-Motor Symptoms Scale.

