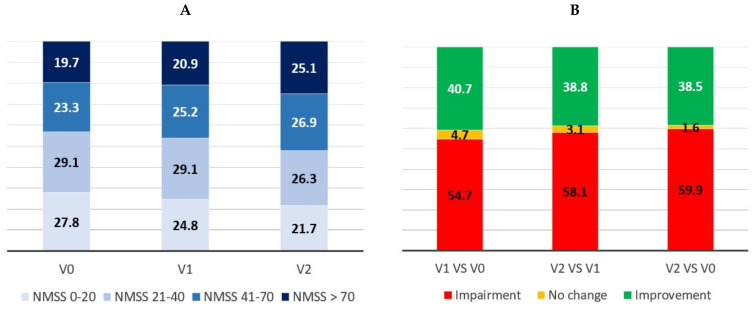
Figure 2.
(A) Percentage of PD patients with mild (NMSS 1–20), moderate (NMSS 21–40), severe (NMSS 41–70), and very severe (NMSS >70) NMS burden at V0 (baseline), V1 (1 year follow-up ± 1 month), and V2 (2-year follow-up ± 1 month). V1 vs. V0, p < 0.016 (N = 600); V2 vs. V1, p = 0.007 (N = 482), All groups; p < 0.0001 (N = 481). (B) Percentage of patients with a greater NMS burden (NMS burden impairment; in red), no change (No changes in the NMSS total score), and a lower NMS burden (NMS burden improvement; in green) at V1 compared to V0, V2 compared to V1, and V2 compared to V0. NMSS, Non-Motor Symptoms Scale.

