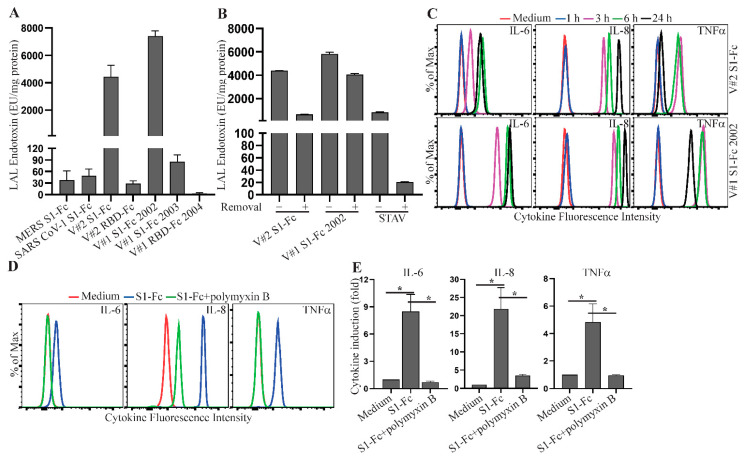
Figure 5.
LPS co-purifying with spike protein reagents induces proinflammatory cytokine production. (A) MERS S1-Fc, SARS CoV-1 S1-Fc, S1-Fc from Vendor #2 (V#2 S1-Fc), S1-Fc from Vendor #1 (lot 24056-2002-2 (V#1 S1-Fc 2002) and lot 24529-2003 (V#1 S1-Fc 2003)), RBD-Fc from Vendor #2 (V#2 RBD-Fc) and RBD-Fc from Vendor #1 (lot 25130-2004, V#1 RBD-Fc 2004), and (B) V#2 S1-Fc, V#1 S1-Fc 2002 and streptavidin (STAV) before and after treatment of endotoxin removal were assessed for the levels of endotoxin using the LAL Chromogenic Endotoxin Quantitation Kit. The concentrations of endotoxin are presented as EU/mg protein. Data shown are mean ± SE of the results from three independent experiments. (C) Time course of S1-Fc-induced cytokine responses. Rested PBMC were cultured with or without 2.0 µg/mL of S1-Fc (V#2 S1-Fc and V#1 S1-Fc 2002) for 1, 3, 6 or 24 h. The levels of IL-6, IL-8 and TNFα in the supernatants of cultured PBMC were assessed using the CBA human inflammatory cytokine kit and flow cytometric analysis. (D,E) Blockade of S1-Fc-induced cytokine response by an LPS inhibitor, polymyxin B. Rested PBMC were cultured with or without 2.0 µg/mL of S1-Fc (V#2 S1-Fc) in the presence or absence of polymyxin B for 3 h. The levels of IL-6, IL-8 and TNFα in the supernatants of cultured PBMC were measured using the CBA human inflammatory cytokine kit and flow cytometric analysis. Data shown in (D) are representative of the flow cytometric results from three healthy donors and data shown in (E) are mean cytokine induction induces (fold) ± SE, which were calculated using cytokine concentrations and the formula: cytokine concentration of treated PBMC/cytokine concentration of untreated PBMC. Statistical analyses were performed using a two-tailed, Student’s t-test. * depicts p < 0.05.

