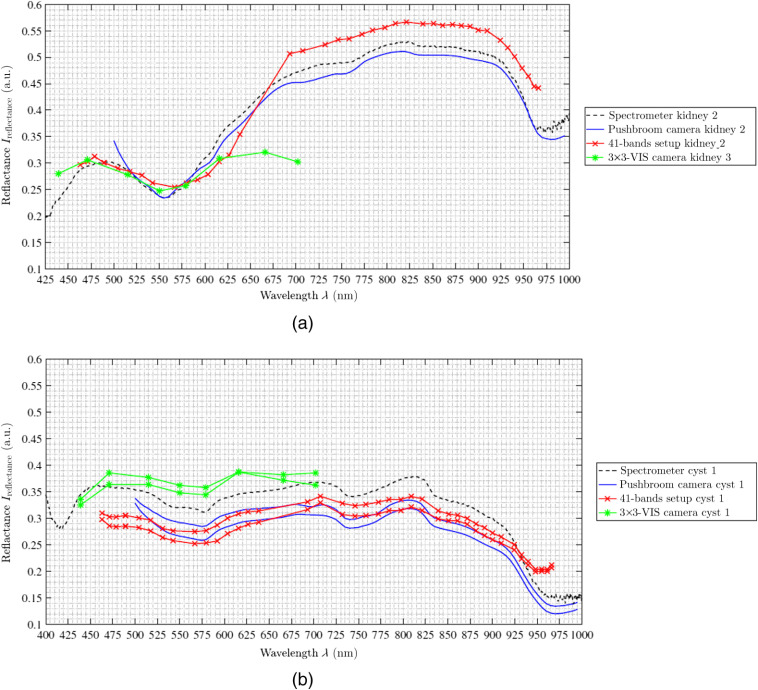
Fig. 9.
Porcine kidney measurements of (a) healthy kidney tissue from the second pig and (b) kidney with a superficial cyst from the first pig, both averaged over both measured ROIs. The spectral curves in (a) are representative for the other two pigs as well, which are omitted for readability. In (b), the spectrometer data of the healthy kidney of the first pig are plotted for comparability.

