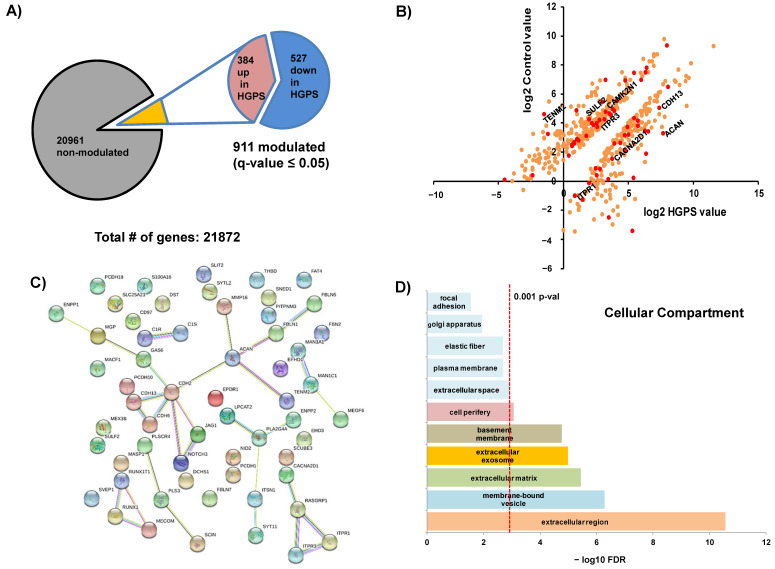
Figure 1.
Summary of the massive genomic analysis (RNAseq). (A) Summary of the NGS showing the 21,872 different quantified transcripts. Of these, 911 were considered to be significantly modulated, with q-values ≤ 0.05. (B) Representation of the values for the 911 significantly modulated transcripts and those coding for Ca2+ flux-related proteins (in red). (C) String 10.1 pathway analysis for the Ca2+ flux-related transcripts showing the interaction networks. (D) Statistical analysis shows that most of those transcripts codify for extracellular and membrane-bound (vesicle/exosome) proteins.

